在OAF页面中集成ECharts以及highcharts用于显示图表
2018-09-19 13:15
471 查看
历史博文中有讲解在请求中输出基础图表的方式,见地址:EBS 请求输出Html报表集成Echarts
本文讲述在OAF中集成这两类图表。
集成的基本思路:在OAF页面中加入一个rawText组件,在rawText中加入html代码即可,如此简单。
步骤一:官网下载echarts,highcharts相应的js,放入OA_HTML路径(本例在OA_HTML中加入了文件夹cux)。
步骤二:写OAF页面及CO。
ECharts示例
EChartsPG
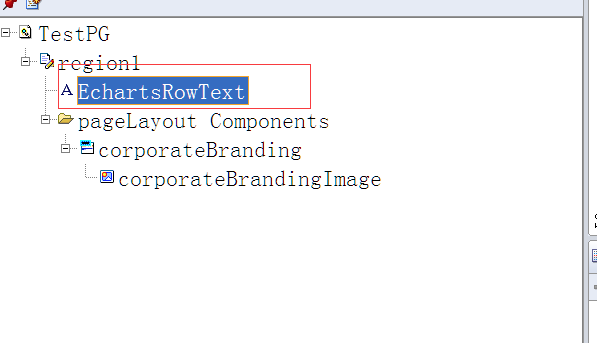
<?xml version = '1.0' encoding = 'UTF-8'?>
<page xmlns:jrad="http://xmlns.oracle.com/jrad" xmlns:oa="http://xmlns.oracle.com/oa" xmlns:ui="http://xmlns.oracle.com/uix/ui" version="10.1.3_" xml:lang="en-US" xmlns:user="http://xmlns.oracle.com/jrad/user" xmlns="http://xmlns.oracle.com/jrad" file-version="$Header$">
<content>
<oa:pageLayout id="region1" amDefName="bailian.oracle.apps.cux.test.server.TestAM" controllerClass="bailian.oracle.apps.cux.test.webui.TestPGCO" windowTitle="TEST PAGE" title="TEST PAGE">
<ui:corporateBranding>
<oa:image id="corporateBrandingImage" source="/OA_MEDIA/FNDSSCORP.gif"/>
</ui:corporateBranding>
<ui:contents>
<oa:rawText id="EchartsRowText" text=""/>
</ui:contents>
</oa:pageLayout>
</content>
</page>
对应的CO(本代码中只给出了静态数据示例):
package cux.oracle.apps.cux.test.webui;
import oracle.apps.fnd.common.VersionInfo;
import oracle.apps.fnd.framework.webui.OAControllerImpl;
import oracle.apps.fnd.framework.webui.OAPageContext;
import oracle.apps.fnd.framework.webui.beans.OARawTextBean;
import oracle.apps.fnd.framework.webui.beans.OAWebBean;
/**
* Controller for ...
*/
public class TestPGCO extends OAControllerImpl
{
public static final String RCS_ID="$Header$";
public static final boolean RCS_ID_RECORDED =
VersionInfo.recordClassVersion(RCS_ID, "%packagename%");
/**
* Layout and page setup logic for a region.
* @param pageContext the current OA page context
* @param webBean the web bean corresponding to the region
*/
public void processRequest(OAPageContext pageContext, OAWebBean webBean)
{
super.processRequest(pageContext, webBean);
// pageContext.removeJavaScriptLibrary("echarts");
if(pageContext.getJavaScriptLibrary("echarts")==null){
pageContext.putJavaScriptLibrary("echarts","cuxjs/echarts.min.js");
}
OARawTextBean rawTextBean =
(OARawTextBean)webBean.findChildRecursive("EchartsRowText");
if (rawTextBean != null) {
String rawTextMessage = null;
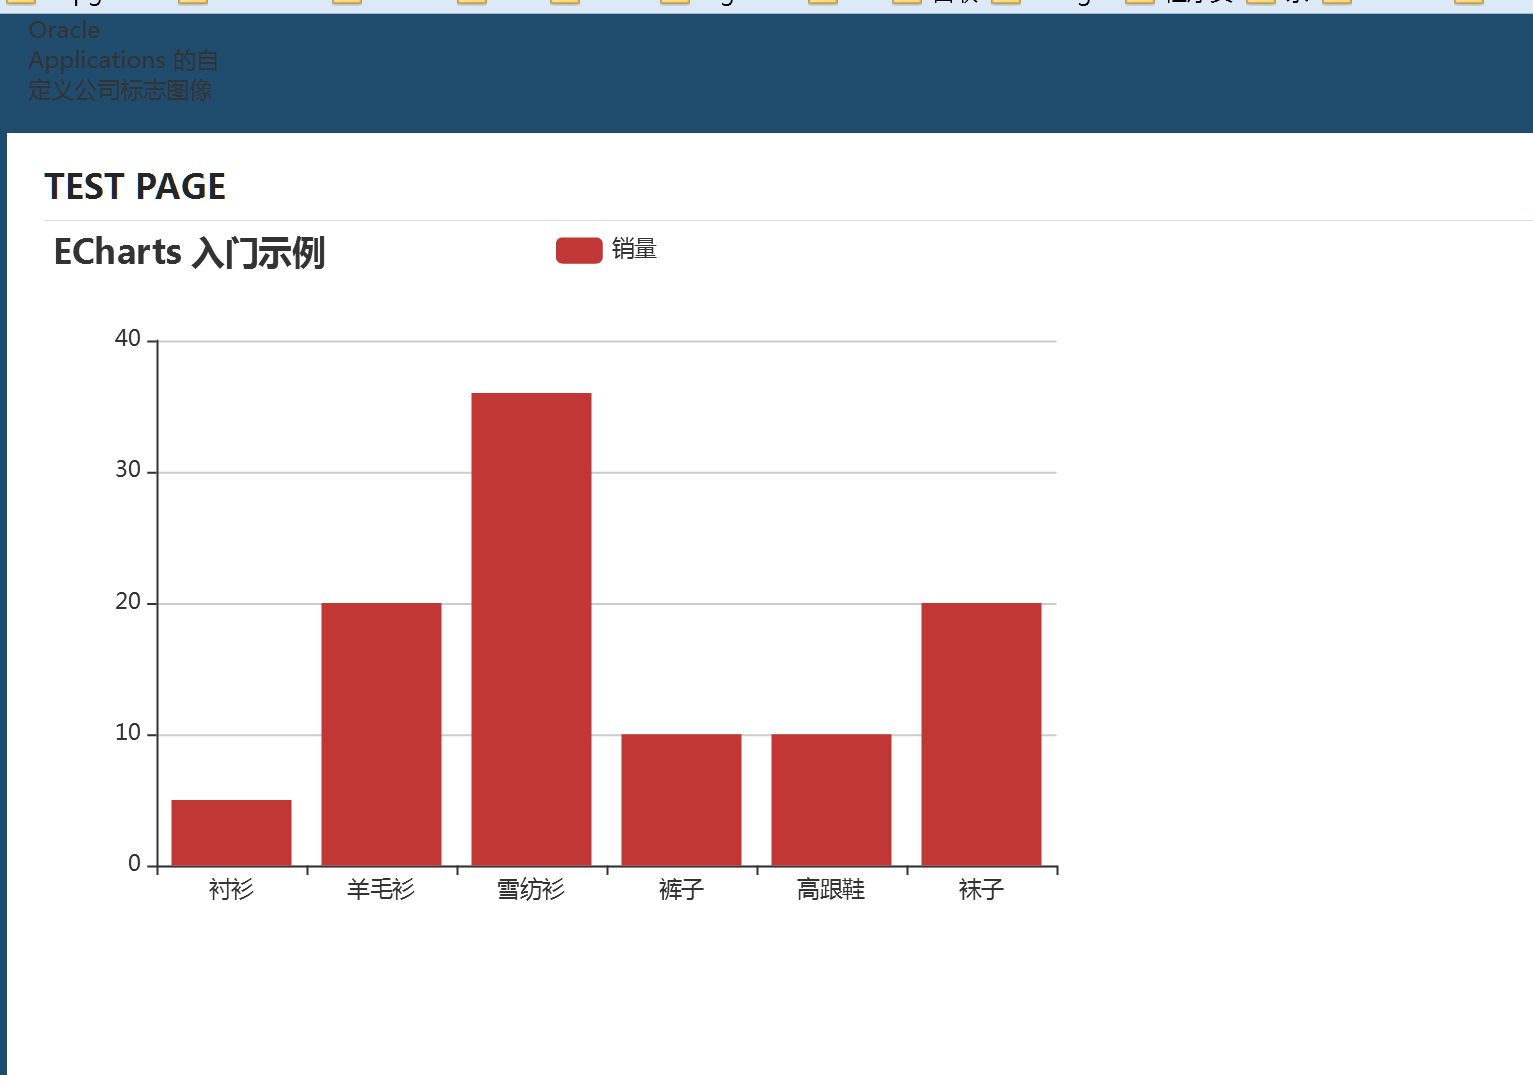
rawTextMessage = "<html>\n" +
"<body>\n" +
" <!-- 为ECharts准备一个具备大小(宽高)的Dom -->\n" +
" <div id=\"main\" style=\"width: 600px;height:400px;\"></div>\n" +
" <script type=\"text/javascript\">\n" +
" // 基于准备好的dom,初始化echarts实例\n" +
" var myChart = echarts.init(document.getElementById('main'));\n" +
"\n" +
" // 指定图表的配置项和数据\n" +
" var option = {\n" +
" title: {\n" +
" text: 'ECharts 入门示例'\n" +
" },\n" +
" tooltip: {},\n" +
" legend: {\n" +
" data:['销量']\n" +
" },\n" +
" xAxis: {\n" +
" data: [\"衬衫\",\"羊毛衫\",\"雪纺衫\",\"裤子\",\"高跟鞋\",\"袜子\"]\n" +
" },\n" +
" yAxis: {},\n" +
" series: [{\n" +
" name: '销量',\n" +
" type: 'bar',\n" +
" data: [5, 20, 36, 10, 10, 20]\n" +
" }]\n" +
" };\n" +
"\n" +
" // 使用刚指定的配置项和数据显示图表。\n" +
" myChart.setOption(option);\n" +
" </script>\n" +
"</body>\n" +
"</html>";
rawTextBean.setText(rawTextMessage);
}
}
/**
* Procedure to handle form submissions for form elements in
* a region.
* @param pageContext the current OA page context
* @param webBean the web bean corresponding to the region
*/
public void processFormRequest(OAPageContext pageContext, OAWebBean webBean)
{
super.processFormRequest(pageContext, webBean);
}
}
效果如下:
HCharts示例:
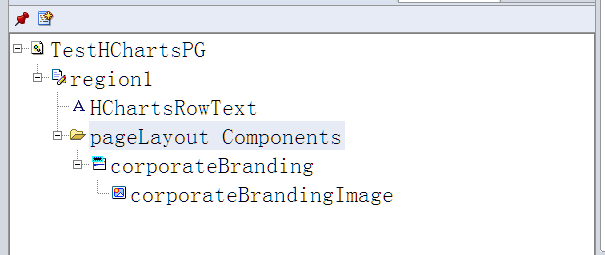
<?xml version = '1.0' encoding = 'UTF-8'?>
<page xmlns:jrad="http://xmlns.oracle.com/jrad" xmlns:oa="http://xmlns.oracle.com/oa" xmlns:ui="http://xmlns.oracle.com/uix/ui" version="10.1.3_" xml:lang="en-US" xmlns:user="http://xmlns.oracle.com/jrad/user" xmlns="http://xmlns.oracle.com/jrad" file-version="$Header$">
<content>
<oa:pageLayout id="region1" amDefName="bailian.oracle.apps.cux.test.server.TestAM" controllerClass="bailian.oracle.apps.cux.test.webui.TestHChartsPGCO" windowTitle="TEST PAGE" title="TEST PAGE">
<ui:corporateBranding>
<oa:image id="corporateBrandingImage" source="/OA_MEDIA/FNDSSCORP.gif"/>
</ui:corporateBranding>
<ui:contents>
<oa:rawText id="HChartsRowText" text=""/>
</ui:contents>
</oa:pageLayout>
</content>
</page>
对应的CO(本代码中只给出了静态数据示例):
package cux.oracle.apps.cux.test.webui;
import oracle.apps.fnd.common.VersionInfo;
import oracle.apps.fnd.framework.webui.OAControllerImpl;
import oracle.apps.fnd.framework.webui.OAPageContext;
import oracle.apps.fnd.framework.webui.beans.OARawTextBean;
import oracle.apps.fnd.framework.webui.beans.OAWebBean;
/**
* Controller for ...
*/
public class TestHChartsPGCO extends OAControllerImpl
{
public static final String RCS_ID="$Header$";
public static final boolean RCS_ID_RECORDED =
VersionInfo.recordClassVersion(RCS_ID, "%packagename%");
/**
* Layout and page setup logic for a region.
* @param pageContext the current OA page context
* @param webBean the web bean corresponding to the region
*/
public void processRequest(OAPageContext pageContext, OAWebBean webBean)
{
super.processRequest(pageContext, webBean);
// pageContext.removeJavaScriptLibrary("hcharts");
if(pageContext.getJavaScriptLibrary("hcharts")==null){
pageContext.putJavaScriptLibrary("hcharts","cuxjs/highcharts.js");
};
OARawTextBean rawTextBean =
(OARawTextBean)webBean.findChildRecursive("HChartsRowText");
if (rawTextBean != null) {
String rawTextMessage = null;
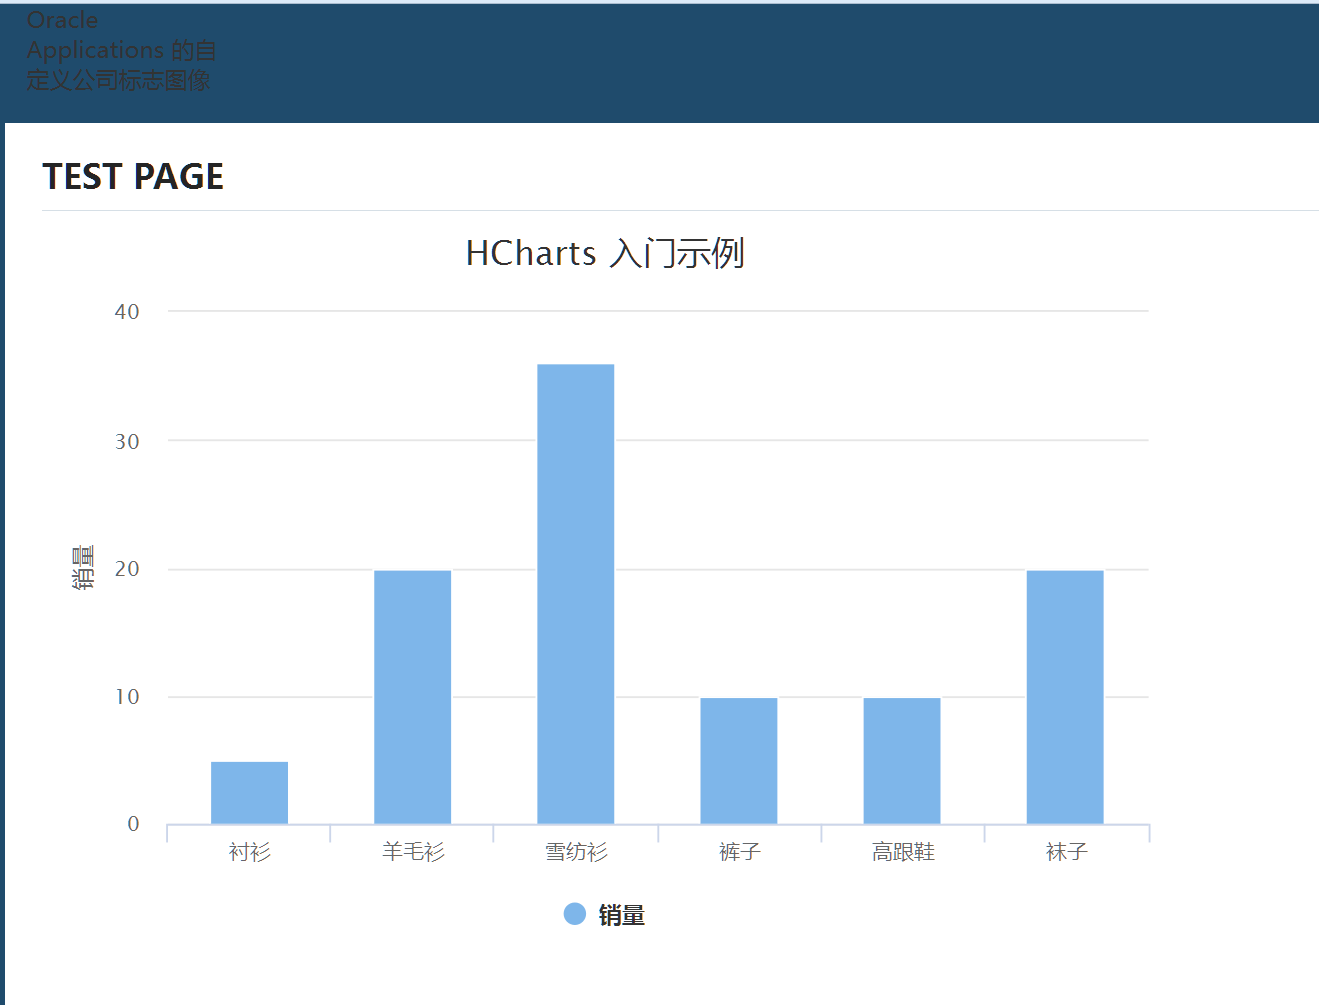
rawTextMessage = "<html>\n" +
"<body>\n" +
" <!-- 为HCharts准备一个具备大小(宽高)的Dom -->\n" +
" <!--<div id=\"container\" style=\"width: 400px;height:400px;\"></div>-->\n" +
" <div id=\"container\" style=\"width: 600px;min-width:400px;height:400px\"></div>\n" +
" <script type=\"text/javascript\">\n" +
" // 基于准备好的dom,初始化echarts实例\n" +
" var chart = Highcharts.chart('container',{\n" +
" chart: {\n" +
" type: 'column'\n" +
" },\n" +
" credits: {\n" +
" enabled:false\n" +
" },\n" +
" title: {\n" +
" text: 'HCharts 入门示例'\n" +
" },\n" +
" xAxis: {\n" +
" categories: [\n" +
" '衬衫','羊毛衫','雪纺衫','裤子','高跟鞋','袜子'\n" +
" ],\n" +
" },\n" +
" yAxis: {\n" +
" min: 0,\n" +
" title: {\n" +
" text: '销量'\n" +
" }\n" +
" },\n" +
" series: [{\n" +
" name: '销量',\n" +
" data: [5, 20, 36, 10, 10, 20]\n" +
" }]\n" +
" });\n" +
" </script>\n" +
"</body>\n" +
"</html>";
rawTextBean.setText(rawTextMessage);
}
}
/**
* Procedure to handle form submissions for form elements in
* a region.
* @param pageContext the current OA page context
* @param webBean the web bean corresponding to the region
*/
public void processFormRequest(OAPageContext pageContext, OAWebBean webBean)
{
super.processFormRequest(pageContext, webBean);
}
}
显示效果如下:

相关文章推荐
- 关于highcharts图表导出中文乱码以及采用post提交产生页面跳转问题
- 关于页面动态创建多个highcharts图表所产生的问题汇总以及分析
- echarts实现一个页面同时显示多个图表
- C#主要用于查询sql的web项目:查询以及页面显示数据非常缓慢的改进方案
- 图表到项目的简单集成(Echarts 和 HighCharts)
- 移动web 页面显示echarts图表
- wkhtmltopdf 将highcharts的页面转为pdf 图表加载不上问题 或者图标显示不全问题解决
- echarts实现一个页面同时显示多个不同形状的图表/动态往图表中存放数据
- highCharts图表应用-实现多种图表的显示
- OAF学习笔记-18- Update后页面显示不是最新的数据的解决方法
- echarts显示图表
- highcharts图表内的tooltip提示框在IE浏览器下出现花屏的问题分析以及解决办法
- 百度echarts 在柱状图 折线图 饼图上 显示y轴对应的数据 以及 图形是否能够拖动的设置
- iOS从系统相册中多选相片以及在viewControl页面中显示
- echarts---一个页面内创建多个图表
- 百度地图集成echarts并且在地图上显示动态告警图形
- 安卓第一次安装与软件更新时显示引导页,其他时候显示别的图片,以及定时进入主页面
- SSH框架网上商城项目第22战之银行图标以及支付页面显示
- js的new Date的一些问题,以及highcharts时间显示16:00
- php中文乱码问题以及页面显示部分后台代码问题