绘图-图形(柱状图)中添加纯文本注释(text)
2018-04-03 15:42
417 查看
转载至:https://blog.csdn.net/you_are_my_dream/article/details/53455256
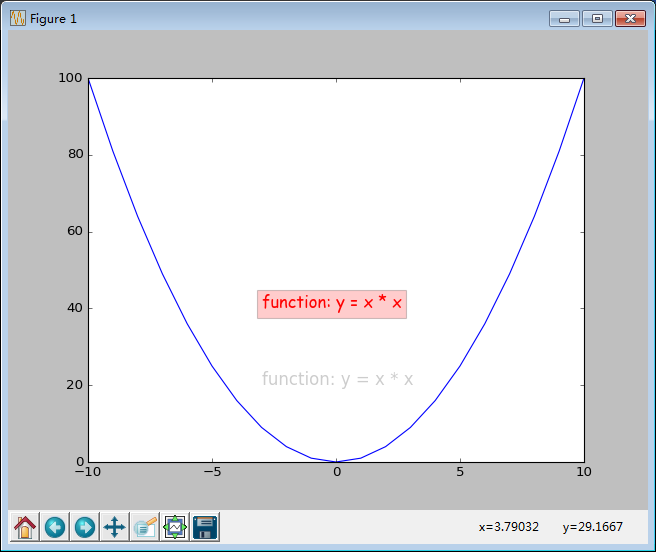
在图形中,通过text添加纯文本的注释
text所有相关的参数:官网链接
[python] view plain copy #!/usr/bin/python
#coding: utf-8
import numpy as np
import matplotlib.pyplot as plt
x = np.arange(-10, 11, 1)
y = x ** 2
plt.plot(x, y)
# 第一个参数是x轴坐标
# 第二个参数是y轴坐标
# 第三个参数是要显式的内容
# alpha 设置字体的透明度
# family 设置字体
# size 设置字体的大小
# style 设置字体的风格
# wight 字体的粗细
# bbox 给字体添加框,alpha 设置框体的透明度, facecolor 设置框体的颜色
plt.text(-3, 20, "function: y = x * x", size = 15, alpha = 0.2)
plt.text(-3, 40, "function: y = x * x", size = 15,\
family = "fantasy", color = "r", style = "italic", weight = "light",\
bbox = dict(facecolor = "r", alpha = 0.2))
plt.show()

相关文章推荐
- 图形中添加纯文本注释(text)
- VS2010 使用TeeChart绘图控件 - 之二 - 绘制图形(折线图,柱状图)
- VS2010 使用TeeChart绘图控件 - 之二 - 绘制图形(折线图,柱状图)
- VS2010 使用TeeChart绘图控件 - 之二 - 绘制图形(折线图,柱状图)
- VS2010 使用TeeChart绘图控件 - 之二 - 绘制图形(折线图,柱状图)
- VS2010 使用TeeChart绘图控件 - 之二 - 绘制图形(折线图,柱状图)
- VS2010 使用TeeChart绘图控件 - 之二 - 绘制图形(折线图,柱状图)
- VS2010 使用TeeChart绘图控件 - 之二 - 绘制图形(折线图,柱状图)
- VS2010 使用TeeChart绘图控件 - 之二 - 绘制图形(折线图,柱状图)
- VS2010 使用TeeChart绘图控件 - 之二 - 绘制图形(折线图,柱状图)
- VS2010 使用TeeChart绘图控件 - 之二 - 绘制图形(折线图,柱状图)
- VS2010 使用TeeChart绘图控件 - 之二 - 绘制图形(折线图,柱状图)
- Android绘图实例(Bitmmap,Canvas,Pain的使用)&动态的在图片上添加文字(canvas.drawText)
- VS2010 MFC使用TeeChart绘图控件之二:绘制图形(折线图,柱状图)
- jqery 绘图插件源码,支持各种饼图,柱状图等统计图形
- VS2010 使用TeeChart绘图控件 - 之二 - 绘制图形(折线图,柱状图)
- GC绘图:绘制Text时,在"&"后的一个字符下添加下划线
- VS2010 使用TeeChart绘图控件 - 之二 - 绘制图形(折线图,柱状图)
- Android图形graphics--自定义TextView,onMeasure和onDraw
- TextView控件上添加表情图片