分享一些Linux下监控软件
2018-03-24 16:51
288 查看
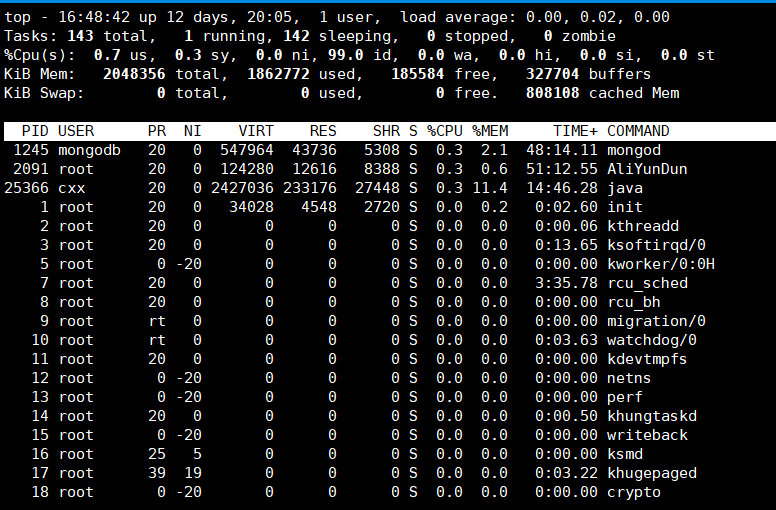
Linux自带的监控界面:(有点搓)
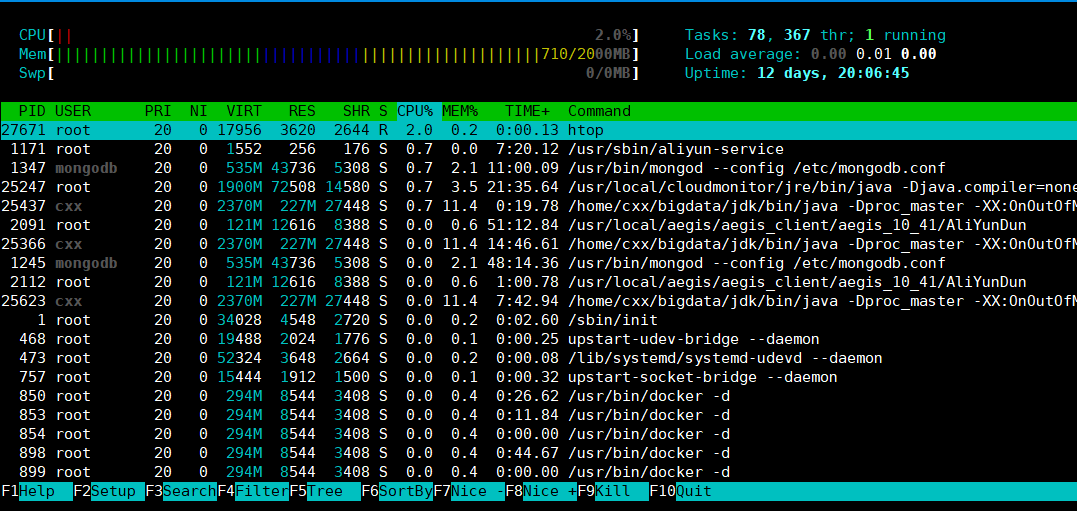
1.Htop安装(linux直接sudo apt-get install htop)完成后,命令行中直接敲击htop命令,即可进入htop的界面
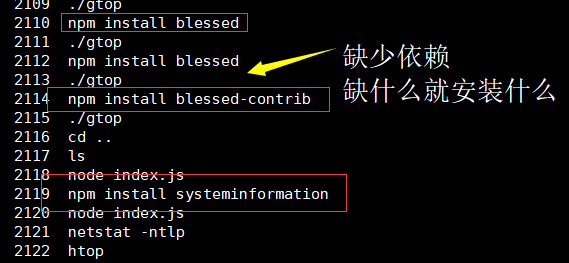
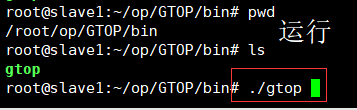
3.Gtop
Node.js >= v4
文件下载:https://gitee.com/chenxingxing6/GTOP
4.Ngxtop
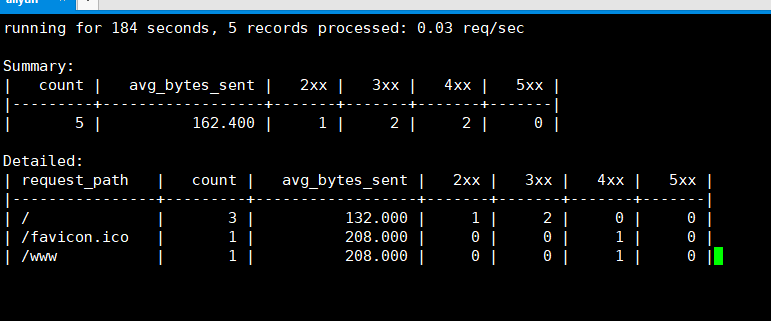
ngxtop 允许你对 NGINX 的访问日志 (access log) 进行实时解析, 并输出类似 top 的有用信息。通过下列命令可以安装 ngxtop:pip install ngxtop在执行 ngxtop 后,它将默认输出如下信息:
$ ngxtop
running for 411 seconds, 64332 records processed: 156.60 req/sec
Summary:
| count | avg_bytes_sent | 2xx | 3xx | 4xx | 5xx |
|---------+------------------+-------+-------+-------+-------|
| 64332 | 2775.251 | 61262 | 2994 | 71 | 5 |
Detailed:
| request_path | count | avg_bytes_sent | 2xx | 3xx | 4xx | 5xx |
|------------------------------------------+---------+------------------+-------+-------+-------+-------|
| /abc/xyz/xxxx | 20946 | 434.693 | 20935 | 0 | 11 | 0 |
| /xxxxx.json | 5633 | 1483.723 | 5633 | 0 | 0 | 0 |
| /xxxxx/xxx/xxxxxxxxxxxxx | 3629 | 6835.499 | 3626 | 0 | 3 | 0 |
| /xxxxx/xxx/xxxxxxxx | 3627 | 15971.885 | 3623 | 0 | 4 | 0 |
| /xxxxx/xxx/xxxxxxx | 3624 | 7830.236 | 3621 | 0 | 3 | 0 |
| /static/js/minified/utils.min.js | 3031 | 1781.155 | 2104 | 927 | 0 | 0 |
| /static/js/minified/xxxxxxx.min.v1.js | 2889 | 2210.235 | 2068 | 821 | 0 | 0 |
| /static/tracking/js/xxxxxxxx.js | 2594 | 1325.681 | 1927 | 667 | 0 | 0 |
| /xxxxx/xxx.html | 2521 | 573.597 | 2520 | 0 | 1 | 0 |
| /xxxxx/xxxx.json | 1840 | 800.542 | 1839 | 0 | 1 | 0 |
原文档:https://github.com/chenxingxing6/ngxtop
1.Htop安装(linux直接sudo apt-get install htop)完成后,命令行中直接敲击htop命令,即可进入htop的界面
3.Gtop
要求
Linux / OSX / Windows (部分支持)Node.js >= v4
安装
$ npm install gtop -g
文件下载:https://gitee.com/chenxingxing6/GTOP
4.Ngxtop
ngxtop 允许你对 NGINX 的访问日志 (access log) 进行实时解析, 并输出类似 top 的有用信息。通过下列命令可以安装 ngxtop:pip install ngxtop在执行 ngxtop 后,它将默认输出如下信息:
$ ngxtop
running for 411 seconds, 64332 records processed: 156.60 req/sec
Summary:
| count | avg_bytes_sent | 2xx | 3xx | 4xx | 5xx |
|---------+------------------+-------+-------+-------+-------|
| 64332 | 2775.251 | 61262 | 2994 | 71 | 5 |
Detailed:
| request_path | count | avg_bytes_sent | 2xx | 3xx | 4xx | 5xx |
|------------------------------------------+---------+------------------+-------+-------+-------+-------|
| /abc/xyz/xxxx | 20946 | 434.693 | 20935 | 0 | 11 | 0 |
| /xxxxx.json | 5633 | 1483.723 | 5633 | 0 | 0 | 0 |
| /xxxxx/xxx/xxxxxxxxxxxxx | 3629 | 6835.499 | 3626 | 0 | 3 | 0 |
| /xxxxx/xxx/xxxxxxxx | 3627 | 15971.885 | 3623 | 0 | 4 | 0 |
| /xxxxx/xxx/xxxxxxx | 3624 | 7830.236 | 3621 | 0 | 3 | 0 |
| /static/js/minified/utils.min.js | 3031 | 1781.155 | 2104 | 927 | 0 | 0 |
| /static/js/minified/xxxxxxx.min.v1.js | 2889 | 2210.235 | 2068 | 821 | 0 | 0 |
| /static/tracking/js/xxxxxxxx.js | 2594 | 1325.681 | 1927 | 667 | 0 | 0 |
| /xxxxx/xxx.html | 2521 | 573.597 | 2520 | 0 | 1 | 0 |
| /xxxxx/xxxx.json | 1840 | 800.542 | 1839 | 0 | 1 | 0 |
原文档:https://github.com/chenxingxing6/ngxtop

相关文章推荐
- 分享几个Linux下监控流量的软件
- linux下安装pycharm和teamviewer以及软件安装的一些知识(链接收集)
- linux 查看系统信息的一些命令及查看已安装软件包的命令
- Linux查看系统信息的一些命令及查看已安装软件包的命令(转)
- 从Windows切换到Linux 一些比较好的软件 持续更新
- 分享Ubuntu下一些很棒的软件
- Linux监控软件之 Zabbix
- Linux查看系统信息的一些命令及查看已安装软件包的命令
- Linux查看系统信息的一些命令及查看已安装软件包的命令
- Linux查看系统信息的一些命令及查看已安装软件包的命令
- 安装Linux必装的一些软件(不断更新)
- Linux下监控网卡流量的软件Nload
- linux下一些软件的安装
- 分享一些免费的,开源的邮件server软件
- linux 故障监控必备五款软件
- Linux查看系统信息的一些命令及查看已安装软件包的命令
- 分享几种Linux软件的安装方法
- Linux查看系统信息的一些命令及查看已安装软件包的命令
- Linux查看系统信息的一些命令及查看已安装软件包的命令(转)
- Linux查看系统信息的一些命令及查看已安装软件包的命令