MATLAB 学习心得(5) 插值
2018-02-09 21:32
281 查看
插值的定义:
在离散数据的基础上补插连续函数,使得这条连续曲线通过全部给定的离散数据点。
插值是离散函数逼近的重要方法,利用它可通过函数在有限个点处的取值状况,估算出函数在其他点处的近似值。
插值:用来填充图像变换时像素之间的空隙。
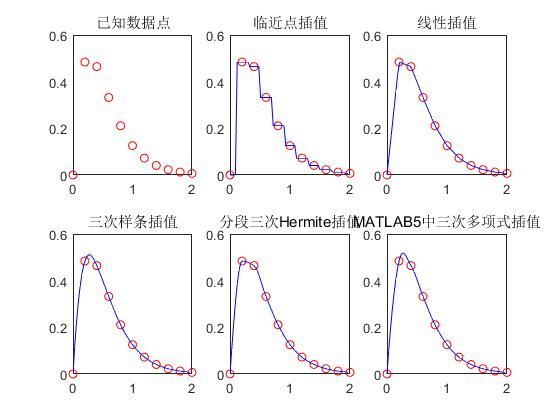
y=(x.^2-3*x+5).*exp(-3*x).*sin(x);
xi=0:0.03:2; %要插值的数据
yi_nearest=interp1(x,y,xi,'nearest'); %临近点插值
yi_linear=interp1(x,y,xi); %默认为线性插值
yi_spine=interp1(x,y,xi,'spine'); %三次样条插值
yi_pchip=interp1(x,y,xi,'pchip'); %分段三次Hermite插值
yi_v5cubic=interp1(x,y,xi,'v5cubic'); %MATLAB5中三次多项式插值
figure; %画图显示
hold on;
subplot(231);
plot(x,y,'ro');
title('已知数据点');
subplot(232);
plot(x,y,'ro',xi,yi_nearest,'b-');
title('临近点插值');
subplot(233);
plot(x,y,'ro',xi,yi_linear,'b-');
title('线性插值');
subplot(234);
plot(x,y,'ro',xi,yi_spine,'b-');
title('三次样条插值');
subplot(235);
plot(x,y,'ro',xi,yi_pchip,'b-');
title('分段三次Hermite插值');
subplot(236);
plot(x,y,'ro',xi,yi_v5cubic,'b-');
title('MATLAB5中三次多项式插值');
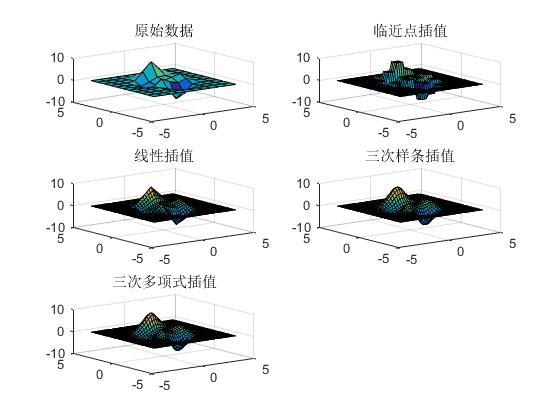
z=peaks(x,y);
[xi,yi]=meshgrid(-4:0.2:4); %插值数据
zi_nearest=interp2(x,y,z,xi,yi,'nearest'); %临近点插值
zi_linear=interp2(x,y,z,xi,yi); %系统默认为线性插值
zi_spline=interp2(x,y,z,xi,yi,'spline'); %三次样条插值
zi_cubic=interp2(x,y,z,xi,yi,'cubic'); %三次多项式插值
figure; %数据显示
hold on;
subplot(321);
surf(x,y,z);
title('原始数据');
subplot(322);
surf(xi,yi,zi_nearest);
title('临近点插值');
subplot(323);
surf(xi,yi,zi_linear);
title('线性插值');
subplot(324);
surf(xi,yi,zi_spline);
title('三次样条插值');
subplot(325);
surf(xi,yi,zi_cubic);
title('三次多项式插值');
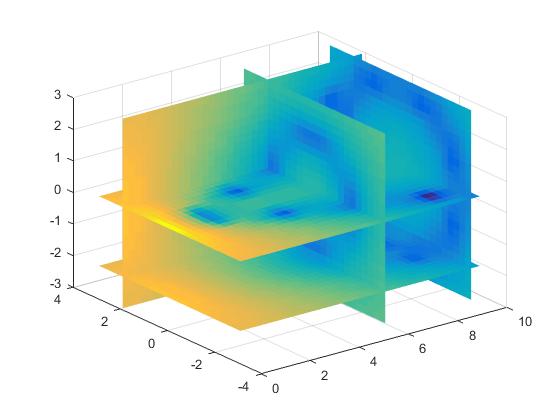
[xi,yi,zi]=meshgrid(.1:.25:10,-3:.25:3,-3:.25:3);
vi = interp3(x,y,z,v,xi,yi,zi); % vi为25*40*25
slice(xi,yi,zi,vi,[6 9.5],2,[-2 .2]);
shading flat
在离散数据的基础上补插连续函数,使得这条连续曲线通过全部给定的离散数据点。
插值是离散函数逼近的重要方法,利用它可通过函数在有限个点处的取值状况,估算出函数在其他点处的近似值。
插值:用来填充图像变换时像素之间的空隙。
一、一维插值 interp1
y = interp1(x,y,xi,'method') xi为变量范围,method为插值形式:不填为默认插值,nearest为临近点插值,spine为三次样条插值,pchine为分段三次hermite插值,V5cubic为MATLAB5中多项式的插值。x=0:0.2:2;y=(x.^2-3*x+5).*exp(-3*x).*sin(x);
xi=0:0.03:2; %要插值的数据
yi_nearest=interp1(x,y,xi,'nearest'); %临近点插值
yi_linear=interp1(x,y,xi); %默认为线性插值
yi_spine=interp1(x,y,xi,'spine'); %三次样条插值
yi_pchip=interp1(x,y,xi,'pchip'); %分段三次Hermite插值
yi_v5cubic=interp1(x,y,xi,'v5cubic'); %MATLAB5中三次多项式插值
figure; %画图显示
hold on;
subplot(231);
plot(x,y,'ro');
title('已知数据点');
subplot(232);
plot(x,y,'ro',xi,yi_nearest,'b-');
title('临近点插值');
subplot(233);
plot(x,y,'ro',xi,yi_linear,'b-');
title('线性插值');
subplot(234);
plot(x,y,'ro',xi,yi_spine,'b-');
title('三次样条插值');
subplot(235);
plot(x,y,'ro',xi,yi_pchip,'b-');
title('分段三次Hermite插值');
subplot(236);
plot(x,y,'ro',xi,yi_v5cubic,'b-');
title('MATLAB5中三次多项式插值');
二、二维插值 interp2
y = interp2(x,y,z,xi,yi,'method') xi为变量范围,yi为变量范围。method为插值形式:不填为默认插值,nearest为临近点插值,spine为三次样条插值,pchine为分段三次hermite插值,V5cubic为MATLAB5中多项式的插值。[x,y]=meshgrid(-4:0.8:4); %原始数据z=peaks(x,y);
[xi,yi]=meshgrid(-4:0.2:4); %插值数据
zi_nearest=interp2(x,y,z,xi,yi,'nearest'); %临近点插值
zi_linear=interp2(x,y,z,xi,yi); %系统默认为线性插值
zi_spline=interp2(x,y,z,xi,yi,'spline'); %三次样条插值
zi_cubic=interp2(x,y,z,xi,yi,'cubic'); %三次多项式插值
figure; %数据显示
hold on;
subplot(321);
surf(x,y,z);
title('原始数据');
subplot(322);
surf(xi,yi,zi_nearest);
title('临近点插值');
subplot(323);
surf(xi,yi,zi_linear);
title('线性插值');
subplot(324);
surf(xi,yi,zi_spline);
title('三次样条插值');
subplot(325);
surf(xi,yi,zi_cubic);
title('三次多项式插值');
三、三维插值 interp3
v = interp2(x,y,z,v,xi,yi,zi,'method') xi为变量范围,yi为变量范围,zi为变量范围。method为插值形式:不填为默认插值,nearest为临近点插值,spine为三次样条插值,pchine为分段三次hermite插值,V5cubic为MATLAB5中多项式的插值。[x,y,z,v]=flow(10);[xi,yi,zi]=meshgrid(.1:.25:10,-3:.25:3,-3:.25:3);
vi = interp3(x,y,z,v,xi,yi,zi); % vi为25*40*25
slice(xi,yi,zi,vi,[6 9.5],2,[-2 .2]);
shading flat

相关文章推荐
- 学习matlab的一点心得体会
- MATLAB学习心得~
- 学习matlab的一点心得体会(转)
- Matlab学习第二天 利用插值
- Matlab学习第二天 插值的用法
- MATLAB 学习心得(1) 函数句柄
- MATLAB学习笔记:插值方法
- matlab学习心得
- matlab学习笔记 插值
- 2.23学习心得 Matlab graythresh函数 形态学开闭操作,腐蚀膨胀的作用
- 学习MATLAB软件心得
- MATLAB 学习心得(2) 两种求导方法
- MATLAB 学习心得(4) 曲线拟合
- matlab学习--插值和拟合
- vue2.X组件学习心得(新手必看篇)
- JSF+Seam框架学习心得
- (转贴)Assembly学习心得
- 版本控制实践和学习心得
- 树莓派学习心得
- EXE;DLL;LIB学习心得