R语言中颜色使用方法参考汇总
2018-02-02 23:50
676 查看
ggplot2包中的颜色使用
载入数据
基本绘图
将变量的值映射到颜色
对色盲友好的调色板
色卡
The RColorBrewer package
Sequential palettes
Qualitative palettes
Diverging palettes
/figure/unnamed-chunk-5-1.png)
/figure/unnamed-chunk-5-2.png)
可以将颜色参数存入变量中便于以后使用
/colorblind_palette.jpg)
来源
由RGB参数转换而来,前两个数字表示红色(R)的值,后四个数字依次代表绿色(G)和蓝色(B)的值。从00到FF是十六进制的范围,0到255是十进制的范围。例如,“#ffffff”是白色,“#990000”是深红色。
/hextable.png)
来源
Easily accessed with


载入数据
基本绘图
将变量的值映射到颜色
对色盲友好的调色板
色卡
The RColorBrewer package
Sequential palettes
Qualitative palettes
Diverging palettes
ggplot2包中的颜色使用
文章来源:cookbook-r载入数据
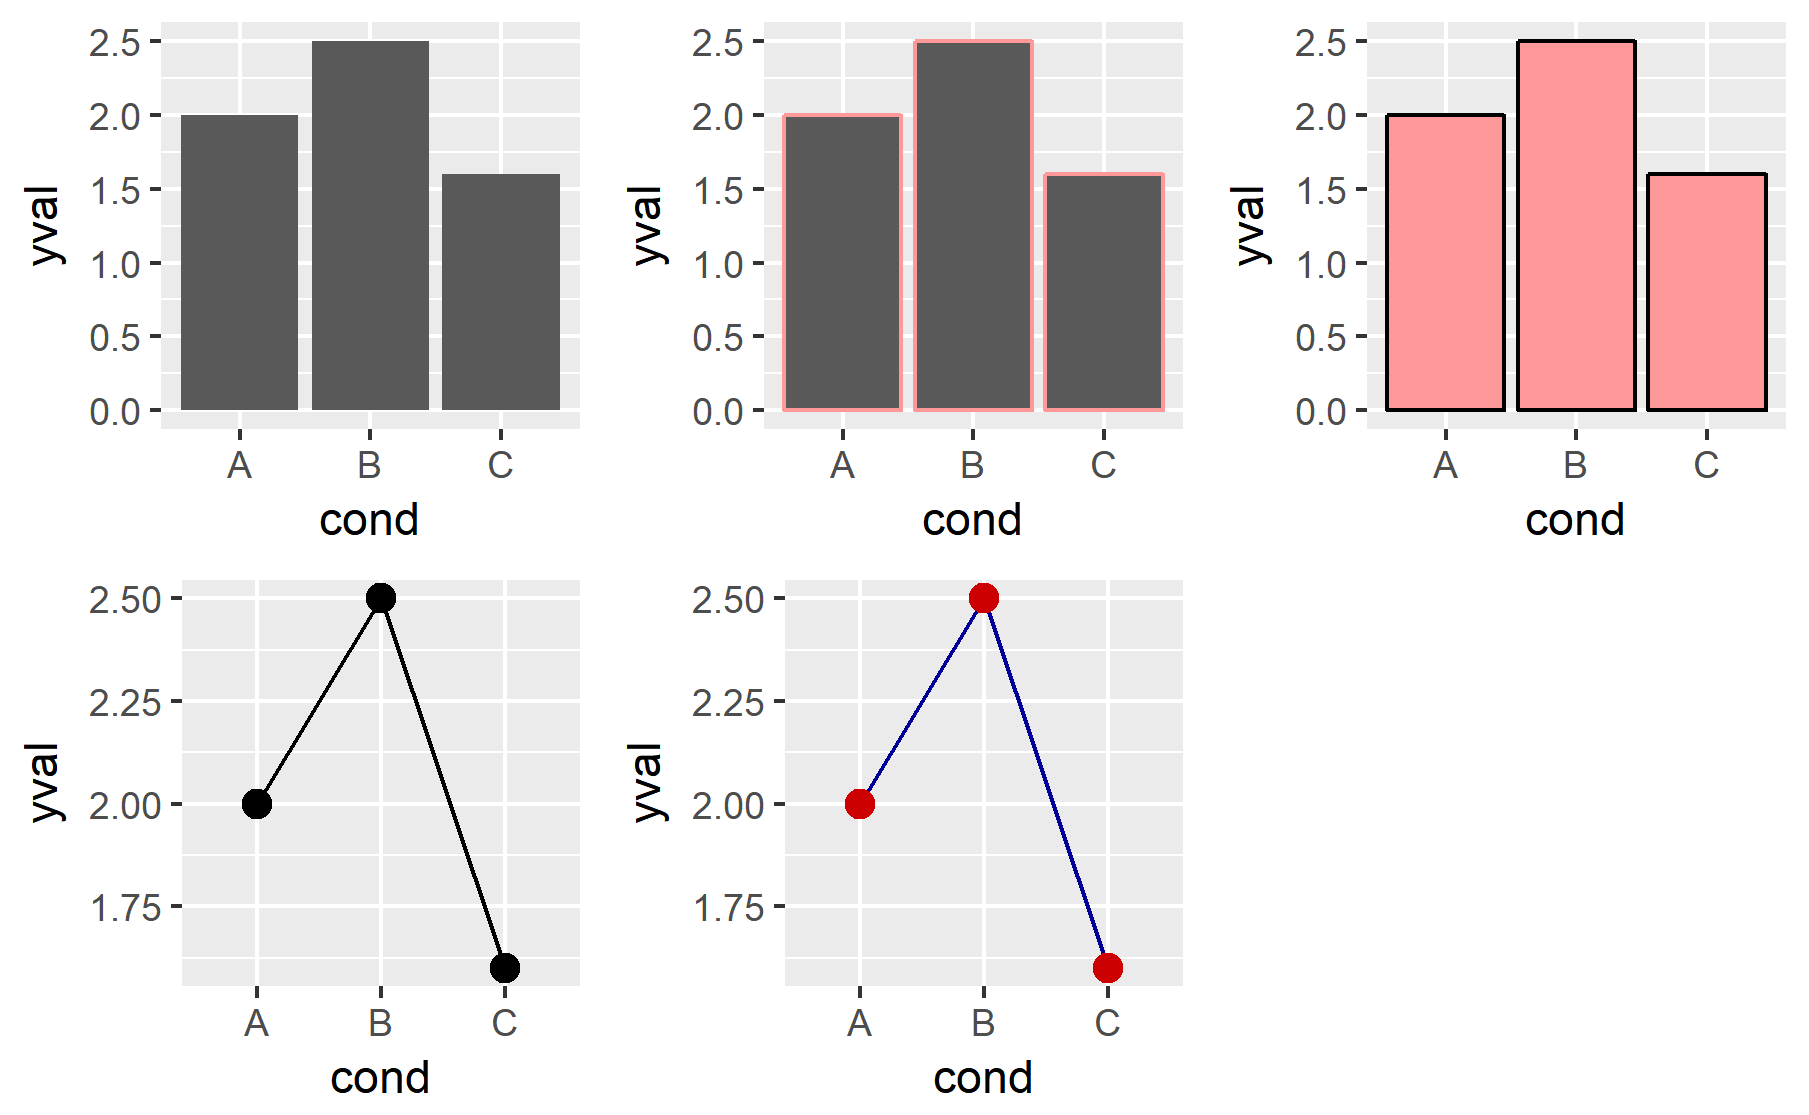
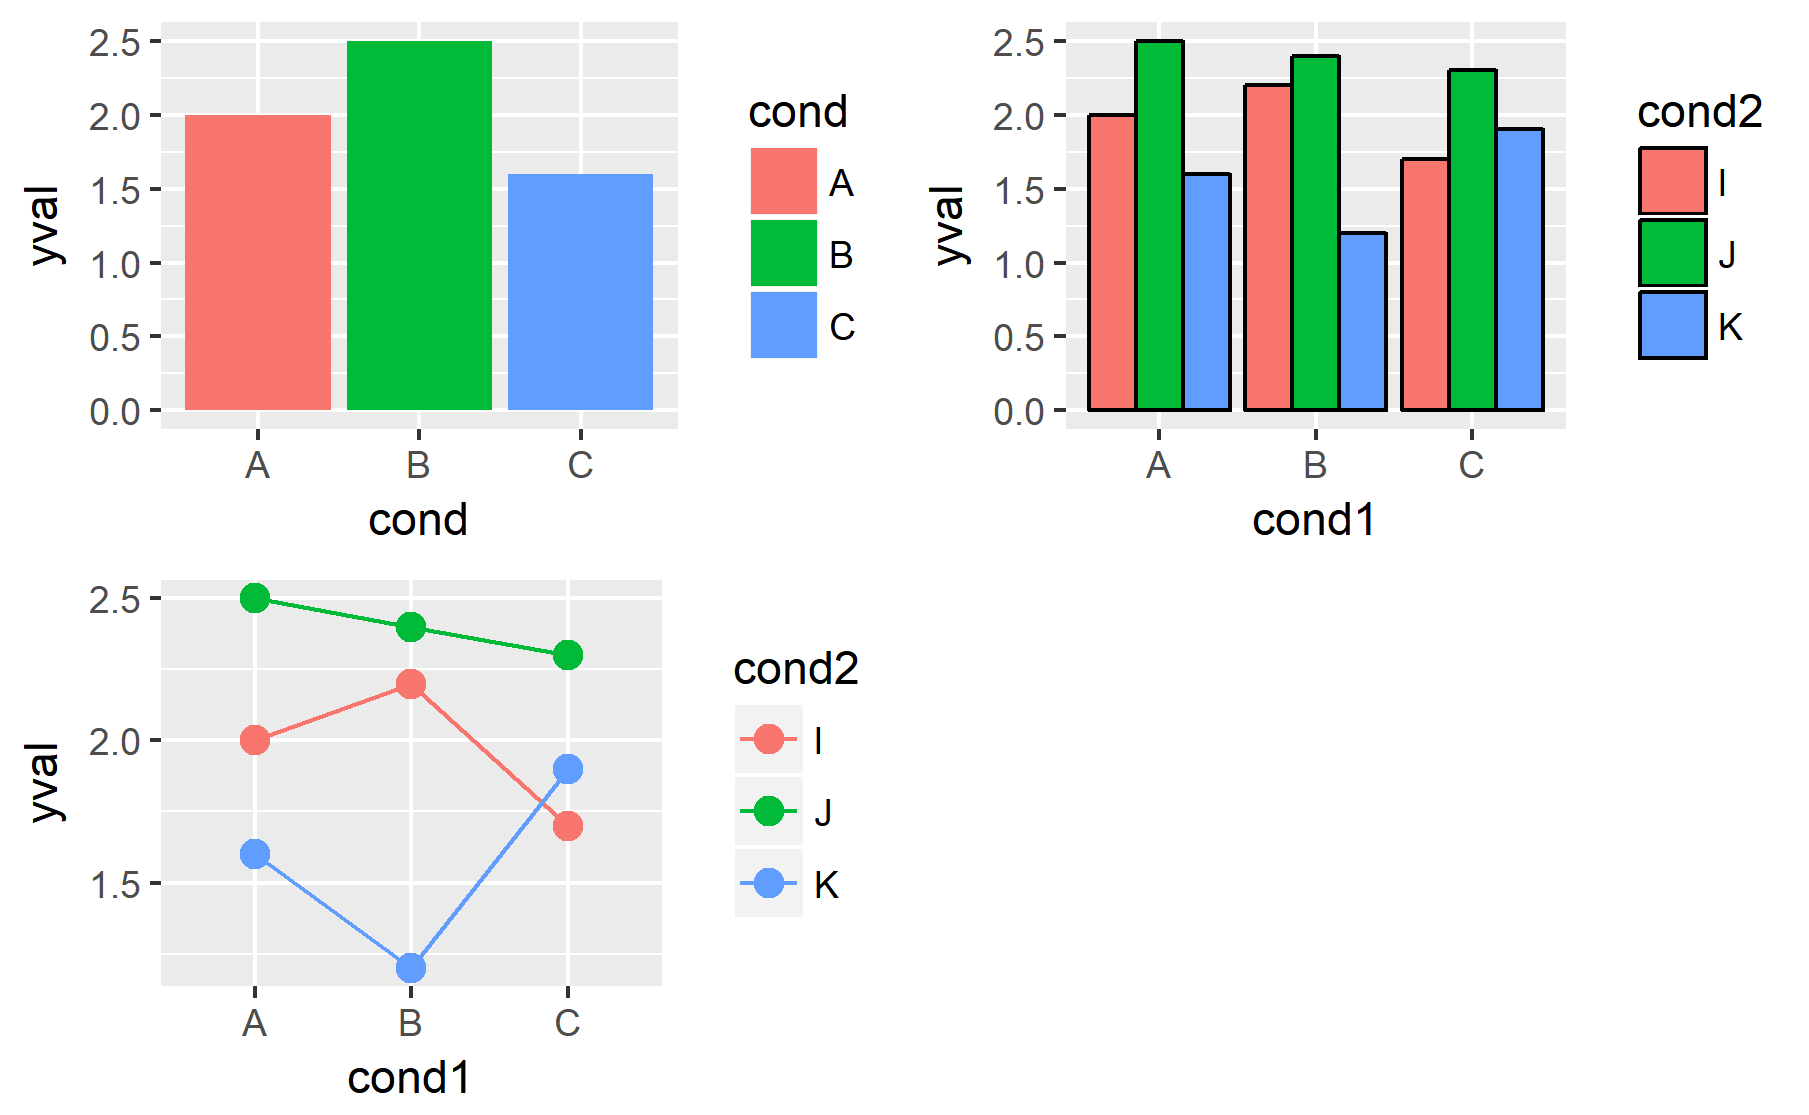
# Two variables
df <- read.table(header=TRUE, text='
cond yval
A 2
B 2.5
C 1.6
')

# Three variables
df2 <- read.table(header=TRUE, text='
cond1 cond2 yval
A      I 2
A      J 2.5
A      K 1.6
B      I 2.2
B      J 2.4
B      K 1.2
C      I 1.7
C      J 2.3
C      K 1.9
')
基本绘图
library(ggplot2)
library(gridExtra)
# 默认的灰色条形图
p1 <- ggplot(df, aes(x=cond, y=yval)) + geom_bar(stat="identity")
# 设置轮廓颜色
p2 <- ggplot(df, aes(x=cond, y=yval)) + geom_bar(stat="identity", colour="#FF9999")
# 设置轮廓和内部颜色
p3 <- ggplot(df, aes(x=cond, y=yval)) + geom_bar(stat="identity", fill="#FF9999", colour="black")

# 黑色数据点和线
p4 <- ggplot(df, aes(x=cond, y=yval)) +
geom_line(aes(group=1)) +  # 注意这里的group组合数据,否则不会显示连线
geom_point(size=3)
# 深蓝色线条,红色数据点
p5 <- ggplot(df, aes(x=cond, y=yval)) +
geom_line(aes(group=1), colour="#000099") +  # 线
geom_point(size=3, colour="#CC0000")         # 点

grid.arrange(p1, p2, p3, p4, p5, ncol = 3)
g <- arrangeGrob(p1, p2, p3, p4, p5, ncol = 3)
ggsave("1.png", g)
将变量的值映射到颜色
将变量的值传入aes()中映射颜色
# 条形图的x轴和颜色根据cond2选择
p6 <- ggplot(df, aes(x=cond, y=yval, fill=cond)) + geom_bar(stat="identity")

# 另一组数据的条形图,颜色根据cond2选择
p7 <- ggplot(df2, aes(x=cond1, y=
4000
yval)) +
geom_bar(aes(fill=cond2),   # 颜色根据cond2选择
stat="identity",
colour="black",    # 给所有长条设置黑色边框
position=position_dodge()) # 设置为并排而不是堆叠

p8 <- ggplot(df2, aes(x=cond1, y=yval)) +
geom_line(aes(colour=cond2, group=cond2)) + # 线条颜色和分组都根据cond2选择
geom_point(aes(colour=cond2), size=3) # 数据点颜色根据cond2选择

grid.arrange(p6, p7, p8, ncol = 2)

g2 <- arrangeGrob(p6, p7, p8, ncol = 2)
ggsave("2.png", g2)
对色盲友好的调色板
可以将颜色参数存入变量中便于以后使用
# The palette with grey:
cbPalette <- c("#999999", "#E69F00", "#56B4E9", "#009E73", "#F0E442", "#0072B2", "#D55E00", "#CC79A7")

# The palette with black:
cbbPalette <- c("#000000", "#E69F00", "#56B4E9", "#009E73", "#F0E442", "#0072B2", "#D55E00", "#CC79A7")

# To use for fills, add
scale_fill_manual(values=cbPalette)

# To use for line and point colors, add
scale_colour_manual(values=cbPalette)
来源
色卡
十六进制颜色代码图由RGB参数转换而来,前两个数字表示红色(R)的值,后四个数字依次代表绿色(G)和蓝色(B)的值。从00到FF是十六进制的范围,0到255是十进制的范围。例如,“#ffffff”是白色,“#990000”是深红色。
来源
The RColorBrewer package
文章来源:r-bloggersEasily accessed with
scale_colour_brewer(), it is trivial to choose among 35 palettes (see
RColorBrewer::display.brewer.all()).
Sequential palettes
suited to ordered data that progress from low to high. Lightness steps dominate the look of these schemes, with light colors for low data values to dark colors for high data values.Qualitative palettes
do not imply magnitude differences between legend classes, and hues are used to create the primary visual differences between classes. Qualitative schemes are best suited to representing nominal or categorical data.Diverging palettes
put equal emphasis on mid-range critical values and extremes at both ends of the data range. The critical class or break in the middle of the legend is emphasized with light colors and low and high extremes are emphasized with dark colors that have contrasting hues.

相关文章推荐
- 最好的FCKeditor编辑器,使用方法(多国语言的)
- C#语言参考视频--方法(2)
- CSS样式,使用VS2005本地文件系统调试能显示,改成使用IIS就死活不显示了!【解决方法汇总说明】
- javascript数组使用调用方法汇总
- .net中多语言资源的访问(使用assemble和卫星assemble的方法)
- javascript数组使用调用方法汇总
- SQL查询语句使用方法参考一
- 请问Lab->RGB, RGB->LAB的颜色转化方法,以及代码,或者有什么参考书籍,谢谢
- vc修改列表框LISTBOX的背景颜色及字体颜色及其使用方法
- 使用JavaScript选择DataGrid行的方法汇总(Select row of DataGrid by JavaScript)
- javascript 中数组使用方法汇总
- word使用样式常碰到的问题和解决方法参考
- C语言程序设计 使用库函数参考手册
- mfc中关于多语言资源的使用方法
- symbian系统皮肤(theme)使用方法汇总
- 在 App_Code 文件夹中同时使用两种语言编程的方法
- C#语言参考---方法(1)
- 使用JavaScript选择GridView行的方法汇总(Select row of GridView by JavaScript)
- JScript 语言参考: escape 方法
- symbian字体使用方法汇总