python中使用k-means对鸢尾花数据集聚类
2018-01-27 23:02
288 查看
代码和结果:
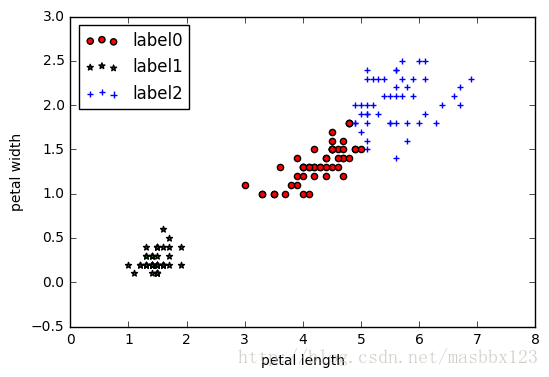
光看这2个特征,那聚类算是非常完美了
import matplotlib.pyplot as plt
import numpy as np
from sklearn.cluster import KMeans
from sklearn import datasets
X = iris.data[:, 2:4] ##表示我们只取特征空间中的后两个维度
print(X.shape)
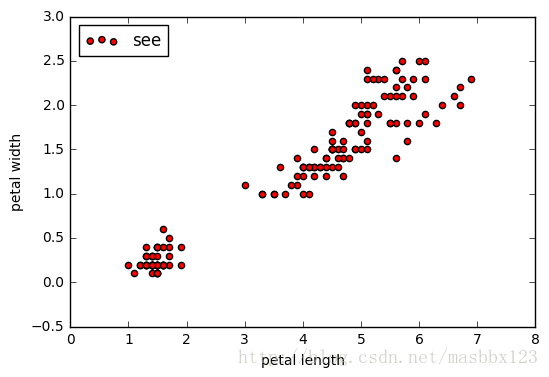
#绘制数据分布图
plt.scatter(X[:, 0], X[:, 1], c = "red", marker='o', label='see')
plt.xlabel('petal length')
plt.ylabel('petal width')
plt.legend(loc=2)
plt.show()estimator = KMeans(n_clusters=3)#构造聚类器
estimator.fit(X)#聚类
label_pred = estimator.labels_ #获取聚类标签
#绘制k-means结果
x0 = X[label_pred == 0]
x1 = X[label_pred == 1]
x2 = X[label_pred == 2]
plt.scatter(x0[:, 0], x0[:, 1], c = "red", marker='o', label='label0')
plt.scatter(x1[:, 0], x1[:, 1], c = "green", marker='*', label='label1')
plt.scatter(x2[:, 0], x2[:, 1], c = "blue", marker='+', label='label2')
plt.xlabel('petal length')
plt.ylabel('petal width')
plt.legend(loc=2)
plt.show()光看这2个特征,那聚类算是非常完美了

相关文章推荐
- Python K-means使用
- 使用Python构建一个基于k-means的文档分类器
- 在 Python中使用 cout << 'Hello,world!' << endl
- 使用python发送简单的邮件
- 在python 中使用 windows dll
- Python模块之chardir: 使用chartdir生成各种图表
- 在python 中使用正则表达式
- 关于在组件GIS开发中使用Python的一点补充说明
- 使用minidom来处理XML的示例(Python 学习)(转载)
- C Java PHP Perl Python 的程序代码美化工具(Pretty Print Program/Source Code Beautifier)使用
- 在IE中使用Python作为开发脚本
- Python使用Com组件及Access查询分析类实现
- 使用SWIG实现C++扩展Python
- unix下面使用python无法广播
- 第一次使用python
- python中使用状态机的简单例子---截取'/x00'之前的字符串
- 使用python写的代码行数统计程序
- 使用Python进行AES加密和解密的示例代码
- ctypes: 使用python调用C编写的动态链接库
- Python指南--使用Python解释器