使用 GDB 查看 Jemalloc 内存布局
2018-01-24 12:03
591 查看
学习中主要参考 @杏林小轩 的 Jemalloc系列:
jemalloc 3.6.0源码详解—[0]基础知识
jemalloc 3.6.0源码详解—[1]Arena
jemalloc 3.6.0源码详解—[2]Chunk
jemalloc 3.6.0源码详解—[3]Run and bins
jemalloc 3.6.0源码详解—[4]Thread caches
jemalloc 3.6.0源码详解—[5]分配及实现
jemalloc 3.6.0源码详解—[6]释放及实现
这里借用部分内容,便于复习;本文补充在 Android设备上查看 Jemalloc 的内存布局.
内存是由一定数量的arenas进行管理.
一个arena被分割成若干chunks, 后者主要负责记录bookkeeping(记录信息).
chunk内部又包含着若干runs, 作为分配小块内存的基本单元.
run由pages组成, 最终被划分成一定数量的regions,
对于small size的分配请求来说, 这些region就相当于user memory.

对应 struct:struct arena_s {
可以看到,总共有两个 arena,每个 arena有36个 bin,但chunk数量不同,两个 arena共有 21个chunk;
需要注意的是:arena本来是 cpu core数目的 4倍,而 Android 设置了最多有 2 个 arena;

实际上,arena 指针是存储在 je_arenas 数组中,shadow的 jearenas就是从这个数据读取的 arena:
{0x7623a00140, 0x7623a8fc00},对应的类型是 (arena_t *);
可以通过如下命令查看 arena具体数据:
1506c
/span>)
chunk内存布局:
查看chunks:
这个数据除了指明各个 chunk指针 (arena_chunk_t),还统计了每个 chunk中的 runs数量;
查看一个chunk:
可以知道的是 chunks是保存在 je_chunks_rtree 数据结构中的。
还没有搞明白这个数据结构如何访问,搞明白了,再补充。
详细查看单个的 chunk:
比如第一个 run是 small run,run大小是0x7000, 包含 7个page,这 7 个 page被平分成了 4个 region;
每个 run 包含 N 个 region,每个 region又包含 N个 PAGE,所以 run大小是 page整数倍;
查看一个run:
我们通过 当前chunk的 map_bits 看下,第一个run的所有page的状态;
可以看到 第 0 ~ 6 的这7个 page都是 allocated状态[1],且属于small run [0];
我们可以找一个 large run验证下:
对于 map_bits的解释,在 arena.h文件中:
0x7623884000 large run 0x7000 -
其总共占了 7个page,其对应的 map_bits的 第 [119] ~ [125] 的7 个page,所以再查看其最后一个 page的状态看下:
其对应的第一个page的 map_bits中也记录了该 large run的大小:7 * PAGE_SIZE
其内容,确实符合规则;
对于chunk中第一个run 0x762380d000,是个 small run:
而对于 small run,对应page的 map_bits的第[5~12]的 8个bit保存其对应的 bin的index
查看所有 runs:
runs是连续存储在 chunks中的:
在chunk中,后续的每个run都是page size的整数倍,且每个run是紧邻的;
可以确认的是,runs的获取,是由 chunk获得的,使用 chunk及其成员 arena_chunk_map_bits_tmap_bits[1];
来获取的每个 chunk的 runs;
其中sizeof (arena_chunk_t) =128,而 header size = 0xd000(13个page = je_map_bias)
je_map_bias是根据chunk的大小 je_chunksize (je_chunk_npages*PAGE_SIZE),以及 arena_chunk_t计算出来的,
在 Android8.0的一个手机上:
chunk与 runs的关系:

查看其中的一个 run 的bitmap:
看到 jerun从开始的位置就是属于第一个 region,header在哪里 ?
且查看 8.0 代码中runlayout,与上图有所不同:

可以看到,当前 run总共有 4个region,且都是使用状态,每个 region的 size 是 0x1400。
但jemalloc中bin要更复杂一些. 直白地说, 可以把bin看作non-full run的仓库, bin负责记录当前arena中某一个size class范围内所有non-full run的使用情况.
当有分配请求时, arena查找相应size class的bin, 找出可用于分配的run, 再由run分配region. 当然, 因为只有small region分配需要run, 所以bin也只对应small size class.
lock: 该lock同arena内部的lock不同, 主要负责保护current run. 而对于run本身的分配和释放还是需要依赖arena lock. 通常情况下, 获得bin lock的前提是获得arena lock, 但反之不成立.
runcur: 当前可用于分配的run, 一般情况下指向地址最低的non-full run, 同一时间一个bin只有一个current run用于分配.
runs: rb tree, 记录当前arena中该bin对应size class的所有non-full runs. 因为分配是通过current run完成的, 所以也相当于current run的仓库.
stats: 统计信息.
这段粗体,摘自 @杏林小轩 的博客;
查看bins:
而实际上,每个 bin都关联着多个 run,其中有的 run已经满了,有的 run还没满,有的 run还在使用中;
每个 run中的 region size是固定的,其实就是与 bin 的 mem class对应;
比如,bin[31] 对应的 mem class是 0x1c00 大小的内存,那么它关联的所有 run的 region size都是 0x1c00;
另外,有个 table:je_size2index_tab 是用来根据 mem size来查找其对应在 bins中的index的:
已知 group N内有四个bin: bin1,bin2,bin3,bin4,这4个bin的size差距都是 deltaA
group N+1内有4个bin:bin5,bin6,bin7,bin8,那么这4个 bin的size差距都是 deltaA * 2
group划分如下:
由于bin的最小 size是 8 byte,所以得到一个 mem地址,获取其 bin index可以这么计算:
bin_idx = (addr -1 ) >> 3
由于每个 bin 的取值范围不同,所以其对应的 index需要在 je_size2index_tab 中重复 (bin_range_size/8 ) 次,这样才能得到正确的 bin index,比如:
第1组中,index1的bin,对应的取值范围是 0x8 ~ 0x10,它的范围只有8 byte,所以 index1 在 je_size2index_tab 中出现1次即可;
第1组中,index2的bin,对应的取值范围是
0x10 ~ 0x20,它的范围有16 byte,所以 index1 在 je_size2index_tab 中出现 16/8 = 2次;
第3组中,index9的bin,对应的取值范围是 0xa0 ~ 0x80,它的范围有32 byte,所以 index9 在 je_size2index_tab
中出现 32/8 = 4次;
依次类推即可;
这样,我们就可以很快的为一个请求的 size找到其合适的 bin 去分配内存了:
比如 arenas[idx]->bins[ (size-1) >> 3] 即是 匹配 size的 bin,在该 bin上挂的 runs中给其分配 region 即可;
换句话说, 如果一个region被tcache记录了, 那么从run的角度看, 它就已经被分配了.
tcache的内容如下,
link: 链接节点, 用于将同一个arena下的所有tcache链接起来.
prof_accumbytes: memory profile相关.
arena: 该tcache所属的arena指针.
ev_cnt: 是tcache内部的一个周期计数器. 每当tcache执行一次分配或释放时, ev_cnt会记录一次. 直到周期到来, jemalloc会执行一次incremental gc.这里的gc会清理tcache中多余的region, 将它们释放掉. 尽管这不意味着系统内存会获得释放, 但可以解放更多的region交给其他更饥饿的线程以分配.
next_gc_bin: 指向下一次gc的binidx. tcache gc按照一周期清理一个bin执行.
tbins: tcache bin数组. 同样外挂在tcache后面.
同arena bin类似, tcache同样有tcache_bin_t和tcache_bin_info_t.tcache_bin_t作用类似于arena bin, 但其结构要比后者更简单. 准确的说, tcache bin并没有分配调度的功能, 而仅起到记录作用. 其内部通过一个stack记录指向外部arena run中的region指针. 而一旦region被cache到tbins内,
就不能再被其他任何线程所使用, 尽管它可能甚至与其他线程tcache中记录的region位于同一个arena run中.
tcache bin结构如下,
tstats: tcache bin内部统计.
low_water: 记录两次gc间tcache内部使用的最低水线. 该数值与下一次gc时尝试释放的region数量有关. 释放量相当于low water数值的3/4.
lg_fill_div: 用作tcache refill时作为除数. 当tcache耗尽时, 会请求arena run进行refill. 但refill不会一次性灌满tcache, 而是依照其最大容量缩小2^lg_fill_div的倍数. 该数值同low_water一样是动态的, 两者互相配合确保tcache处于一个合理的充满度.
ncached: 指当前缓存的region数量, 同时也代表栈顶index.
avail: 保存region指针的stack, 称为avail-stack.
tcache_bin_info_t保存tcache bin的静态信息. 其本身只保存了tcache max容量. 该数值是在tcache boot时根据相对应的arena bin的nregs决定的. 通常等于nregs的二倍, 但不得超过TCACHE_NSLOTS_SMALL_MAX. 该数值默认为200, 但在android中大大提升了该限制, small bins不得超过8, large bins则为16.
tcache的调试目前还没有搞定,还无法从 gdb中查看 tcache,待调查;
1.优先 tcache,根据 tcache_bin查找合适的run,找到空闲的 region进行分配
2.继而选择一个 arena,然后根据bins,选择对应 bins上挂着的run,再从run中选取合适的 region分配
当然遇到分配过程中的某一个失败时,可以选取一个 arena,进行分配新的 chunk,run,region;

jemalloc 3.6.0源码详解—[0]基础知识
jemalloc 3.6.0源码详解—[1]Arena
jemalloc 3.6.0源码详解—[2]Chunk
jemalloc 3.6.0源码详解—[3]Run and bins
jemalloc 3.6.0源码详解—[4]Thread caches
jemalloc 3.6.0源码详解—[5]分配及实现
jemalloc 3.6.0源码详解—[6]释放及实现
这里借用部分内容,便于复习;本文补充在 Android设备上查看 Jemalloc 的内存布局.
1.概念
jemalloc对内存划分按照如下由高到低的顺序:内存是由一定数量的arenas进行管理.
一个arena被分割成若干chunks, 后者主要负责记录bookkeeping(记录信息).
chunk内部又包含着若干runs, 作为分配小块内存的基本单元.
run由pages组成, 最终被划分成一定数量的regions,
对于small size的分配请求来说, 这些region就相当于user memory.
2.使用shadow查看Jemalloc内存
shadow使用及配置:Shadow2.1 查看 arenas
arena 指针: (arena_t *)对应 struct:struct arena_s {
(gdb) jearenas
index    address         bins    chunks    threads
------------------------------------------------------
0        0x7623a00140    36      17

1        0x7623a8fc00    36      4
可以看到,总共有两个 arena,每个 arena有36个 bin,但chunk数量不同,两个 arena共有 21个chunk;
需要注意的是:arena本来是 cpu core数目的 4倍,而 Android 设置了最多有 2 个 arena;
实际上,arena 指针是存储在 je_arenas 数组中,shadow的 jearenas就是从这个数据读取的 arena:
(gdb) p je_arenas
$1 = (arena_t **) 0x7623a87c00
(gdb) p *je_arenas@2
$2 = {0x7623a00140, 0x7623a8fc00}
从上面 jearenas的打印,我们知道两个 arena 的指针分别是:{0x7623a00140, 0x7623a8fc00},对应的类型是 (arena_t *);
可以通过如下命令查看 arena具体数据:
(gdb) p *((arena_t *)0x7623a00140)
$4 = {
ind = 0,
nthreads = {10, 10},
lock = {
lock = {
__private = {0, 0, 0, 0, 0, 0, 0, 0, 0, 0}
},
witness = {
name = 0x0,
rank = 0,
comp = 0x0,
link = {
qre_next = 0x0,
qre_prev = 0x0
}
}
},
stats = {
.....
2.2 查看 chunks
chunk指针 :(arena_chunk_t*<1506c
/span>)
struct arena_chunk_s {
/*
* A pointer to the arena that owns the chunk is stored within the node.
* This field as a whole is used by chunks_rtree to support both
* ivsalloc() and core-based debugging.
*/
extent_node_t node;
/*
* True if memory could be backed by transparent huge pages. This is
* only directly relevant to Linux, since it is the only supported
* platform on which jemalloc interacts with explicit transparent huge
* page controls.
*/
bool hugepage;
/*
* Map of pages within chunk that keeps track of free/large/small. The
* first map_bias entries are omitted, since the chunk header does not
* need to be tracked in the map. This omission saves a header page
* for common chunk sizes (e.g. 4 MiB).
*/
arena_chunk_map_bits_t map_bits[1]; /* Dynamically sized. */
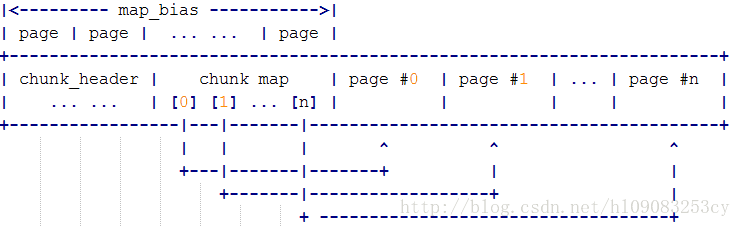
};chunk内存布局:
查看chunks:
(gdb) jechunks
addr            arena           no_runs
-------------------------------------------
0x7604800000    0x7623a00140    4
0x7604a00000    0x7623a00140    13
0x7605600000    0x7623a00140    58
0x7605800000    0x7623a8fc00    12
0x7605a00000    0x7623a00140    99
0x7606000000    0x7623a00140    42
0x7606200000    0x7623a00140    73
0x7607800000    0x7623a8fc00    103
0x7607a00000    0x7623a00140    69
0x7607c00000    0x7623a8fc00    53
0x7608400000    0x7623a00140    91
0x7613400000    0x7623a00140    94
0x7613600000    0x7623a00140    37
0x7613800000    0x7623a00140    31
0x7613a00000    0x7623a00140    23
0x7613c00000    0x7623a00140    33
0x7613e00000    0x7623a00140    22
0x7614000000    0x7623a00140    7
0x7615e00000    0x7623a00140    171
0x7618a00000    0x7623a8fc00    158
0x7623800000    0x7623a00140    174
可以看到共有 21 chunk;与上面 jearenas统计的数据符合;
这个数据除了指明各个 chunk指针 (arena_chunk_t),还统计了每个 chunk中的 runs数量;
查看一个chunk:
(gdb) p *(arena_chunk_t*)0x7604800000
$12 = {
node = {
en_arena = 0x7623a00140, /* arena */
en_addr = 0x7604800000,
en_size = 2097152, /* Total region size. */
en_sn = 16,
en_zeroed = true,
en_committed = true,
en_achunk = true,
en_prof_tctx = 0x0,
rd = {
rd_link = {
qre_next = 0x0,
qre_prev = 0x0
}
},
cc_link = {
qre_next = 0x0,
qre_prev = 0x0
},
{
szsnad_link = {
rbn_left = 0x7623800000,
rbn_right_red = 0x7604a00000
},
ql_link = {
qre_next = 0x7623800000,
qre_prev = 0x7604a00000
}
},
ad_link = {
rbn_left = 0x0,
rbn_right_red = 0x0
}
},
hugepage = true,
map_bits = {{
bits = 2015216
}}
}
可以看到这个 chunk所属的 arena是 0x7623a00140, chunk的大小是 2M。可以知道的是 chunks是保存在 je_chunks_rtree 数据结构中的。
还没有搞明白这个数据结构如何访问,搞明白了,再补充。
详细查看单个的 chunk:
(gdb) jechunk 0x7623800000
This chunk belongs to the arena at 0x7623a00140.

addr            info                  size       usage
------------------------------------------------------------
0x7623800000    headers               0xd000     -
0x762380d000    small run (0x1c00)    0x7000     4/4
0x7623814000    small run (0xc00)     0x3000     4/4
0x7623817000    small run (0x50)      0x5000     256/256
0x762381c000    small run (0x20)      0x1000     128/128
0x762381d000    small run (0x1000)    0x1000     1/1
0x762381e000    small run (0x1000)    0x1000     1/1
0x762381f000    small run (0x1000)    0x1000     1/1
0x7623820000    small run (0x200)     0x1000     8/8
0x7623821000    small run (0x50)      0x5000     256/256
0x7623826000    small run (0x20)      0x1000     128/128
...
arena_chunk_t中的 map_bits用来记录当前chunk偏移 0xd000(je_map_bias) 之后的所有的 page的使用状态;
比如第一个 run是 small run,run大小是0x7000, 包含 7个page,这 7 个 page被平分成了 4个 region;
每个 run 包含 N 个 region,每个 region又包含 N个 PAGE,所以 run大小是 page整数倍;
查看一个run:
(gdb) jerun 0x762380d000
*    status    address         preview
---------------------------------------------------
0    used      0x762380d000    0000007623812400
1    used      0x762380ec00    0000000000000000
2    used      0x7623810800    0000007613505000
3    used      0x7623812400    0000007613506c00
这个 run是当前chunk的第一个run,包含4个 region,都是使用状态,每个 region的开始地址也标注了;
我们通过 当前chunk的 map_bits 看下,第一个run的所有page的状态;
(gdb) p /t ((arena_chunk_t*)0x7623800000)->map_bits[0]
$155 = {
bits = 1111100001
}
(gdb) p /t ((arena_chunk_t*)0x7623800000)->map_bits[1]
$156 = {
bits = 10001111100001
}
(gdb) p /t ((arena_chunk_t*)0x7623800000)->map_bits[2]
$157 = {
bits = 100001111100001
}
(gdb) p /t ((arena_chunk_t*)0x7623800000)->map_bits[3]
$158 = {
bits = 110001111100001
}
(gdb) p /t ((arena_chunk_t*)0x7623800000)->map_bits[4]
$159 = {
bits = 1000001111100001
}
(gdb) p /t ((arena_chunk_t*)0x7623800000)->map_bits[5]
$160 = {
bits = 1010001111100001
}
(gdb) p /t ((arena_chunk_t*)0x7623800000)->map_bits[6]
$161 = {
bits = 1100001111100001
}
通过 struct arena_chunk_map_bits_s,我们知道, 对应 bits的 第 [0] bit,代表是否被 allocated,第[1] bit代表是否 large run,可以看到 第 0 ~ 6 的这7个 page都是 allocated状态[1],且属于small run [0];
我们可以找一个 large run验证下:
(gdb) jechunk 0x7623800000
This chunk belongs to the arena at 0x7623a00140.

addr            info                  size       usage
------------------------------------------------------------
0x7623800000    headers               0xd000     -
0x762380d000    small run (0x1c00)    0x7000     4/4
0x7623814000    small run (0xc00)     0x3000     4/4
...
0x7623883000    small run (0x40)      0x1000     64/64
0x7623884000    large run             0x7000     -
0x762388b000    small run (0xc00)     0x3000     4/4

(gdb) p  (0x7623884000-0x762380d000)/4096
$163 = 119
(gdb) p /t ((arena_chunk_t*)0x7623800000)->map_bits[118]
$164 = {
bits = 10000001
}
(gdb) p /t ((arena_chunk_t*)0x7623800000)->map_bits[119]
$165 = {
bits = 1111111111100011
}
可以看到,0x7623884000 对应的 large run,其第1个 bit是 1;对于 map_bits的解释,在 arena.h文件中:
/* Each element of the chunk map corresponds to one page within the chunk. */
struct arena_chunk_map_bits_s {
/*
* Run address (or size) and various flags are stored together.  The bit
* layout looks like (assuming 32-bit system):
*
*   ???????? ???????? ???nnnnn nnndumla
*
* ? : Unallocated: Run address for first/last pages, unset for internal
*                  pages.
*     Small: Run page offset.
*     Large: Run page count for first page, unset for trailing pages.
* n : binind for small size class, BININD_INVALID for large size class.
* d : dirty?
* u : unzeroed?
* m : decommitted?
* l : large?
* a : allocated?
*
* Following are example bit patterns for the three types of runs.
*
* p : run page offset
* s : run size
* n : binind for size class; large objects set these to BININD_INVALID
* x : don't care
* - : 0
* + : 1
* [DUMLA] : bit set
* [dumla] : bit unset
*
*   Unallocated (clean):
*     ssssssss ssssssss sss+++++ +++dum-a
*     xxxxxxxx xxxxxxxx xxxxxxxx xxx-Uxxx
*     ssssssss ssssssss sss+++++ +++dUm-a
*
*   Unallocated (dirty):
*     ssssssss ssssssss sss+++++ +++D-m-a
*     xxxxxxxx xxxxxxxx xxxxxxxx xxxxxxxx
*     ssssssss ssssssss sss+++++ +++D-m-a
*
*   Small:
*     pppppppp pppppppp pppnnnnn nnnd---A
*     pppppppp pppppppp pppnnnnn nnn----A
*     pppppppp pppppppp pppnnnnn nnnd---A
*
*   Large:
*     ssssssss ssssssss sss+++++ +++D--LA
*     xxxxxxxx xxxxxxxx xxxxxxxx xxxxxxxx
*     -------- -------- ---+++++ +++D--LA
*
*   Large (sampled, size <= LARGE_MINCLASS):
*     ssssssss ssssssss sssnnnnn nnnD--LA
*     xxxxxxxx xxxxxxxx xxxxxxxx xxxxxxxx
*     -------- -------- ---+++++ +++D--LA
*
*   Large (not sampled, size == LARGE_MINCLASS):
*     ssssssss ssssssss sss+++++ +++D--LA
*     xxxxxxxx xxxxxxxx xxxxxxxx xxxxxxxx
*     -------- -------- ---+++++ +++D--LA
*/
size_t				bits;
#define	CHUNK_MAP_ALLOCATED	((size_t)0x01U)
#define	CHUNK_MAP_LARGE		((size_t)0x02U)
#define	CHUNK_MAP_STATE_MASK	((size_t)0x3U)

#define	CHUNK_MAP_DECOMMITTED	((size_t)0x04U)
#define	CHUNK_MAP_UNZEROED	((size_t)0x08U)
#define	CHUNK_MAP_DIRTY		((size_t)0x10U)
#define	CHUNK_MAP_FLAGS_MASK	((size_t)0x1cU)

#define	CHUNK_MAP_BININD_SHIFT	5
#define	BININD_INVALID		((size_t)0xffU)
#define	CHUNK_MAP_BININD_MASK	(BININD_INVALID << CHUNK_MAP_BININD_SHIFT)
#define	CHUNK_MAP_BININD_INVALID CHUNK_MAP_BININD_MASK

#define	CHUNK_MAP_RUNIND_SHIFT	(CHUNK_MAP_BININD_SHIFT + 8)
#define	CHUNK_MAP_SIZE_SHIFT	(CHUNK_MAP_RUNIND_SHIFT - LG_PAGE)
#define	CHUNK_MAP_SIZE_MASK						\
(~(CHUNK_MAP_BININD_MASK | CHUNK_MAP_FLAGS_MASK | CHUNK_MAP_STATE_MASK))
};
所以,对于该 large run :0x7623884000 large run 0x7000 -
其总共占了 7个page,其对应的 map_bits的 第 [119] ~ [125] 的7 个page,所以再查看其最后一个 page的状态看下:
(gdb) p /t ((arena_chunk_t*)0x7623800000)->map_bits[125]
$169 = {
bits = 1111111100011
}
(gdb) p ((arena_chunk_t*)0x7623800000)->map_bits[119]->bits >> 13 $179 = 7
其对应的第一个page的 map_bits中也记录了该 large run的大小:7 * PAGE_SIZE
其内容,确实符合规则;
对于chunk中第一个run 0x762380d000,是个 small run:
(gdb) p  ((arena_chunk_t*)0x7623800000)->map_bits[0]->bits >> 13
$172 = 0
(gdb) p  ((arena_chunk_t*)0x7623800000)->map_bits[1]->bits >> 13
$173 = 1
(gdb) p  ((arena_chunk_t*)0x7623800000)->map_bits[2]->bits >> 13
$174 = 2
(gdb) p  ((arena_chunk_t*)0x7623800000)->map_bits[3]->bits >> 13
$175 = 3
(gdb) p  ((arena_chunk_t*)0x7623800000)->map_bits[4]->bits >> 13
$176 = 4
(gdb) p  ((arena_chunk_t*)0x7623800000)->map_bits[5]->bits >> 13
$177 = 5
(gdb) p  ((arena_chunk_t*)0x7623800000)->map_bits[6]->bits >> 13
$178 = 6
也验证了,map_bits保存其的状态 bits的高19位,保存着当前 page 在该run中的 offset;
而对于 small run,对应page的 map_bits的第[5~12]的 8个bit保存其对应的 bin的index
0x762380d000 small run (0x1c00) 0x7000 4/4该run共 7个page,其状态对应 map_bits的起始 7个元素,当前run第一个 page的状态中保存有该run对应的bin index:
(gdb) p   ((arena_chunk_t*)0x7623800000)->map_bits[0]->bits << 19 >> 24
$194 = 31

(gdb) jebins
arena @ 0x7623a00140
index    addr            size      runcur
---------------------------------------------------
0        0x7623a00ac0    0x8       0x7623801c28
1        0x7623a00b68    0x10      0x7613408348
2        0x7623a00c10    0x20      0x7615e03b48
3        0x7623a00cb8    0x30      0x76134084c8
4        0x7623a00d60    0x40      0x7623803548
...
30       0x7623a01e70    0x1800    0x76084044a8
31       0x7623a01f18    0x1c00    0x7608401808
32       0x7623a01fc0    0x2000    0x7608403f68
33       0x7623a02068    0x2800    0x7606207568
34       0x7623a02110    0x3000    0x7607a07f88
35       0x7623a021b8    -         -
可以看到 31号bin对应的 run size确实是 0x1c00;
2.3 查看 runs
run指针:(arena_run_t *)struct arena_run_s {
/* Index of bin this run is associated with. */
szind_t binind;
/* Number of free regions in run. */
unsigned nfree;
/* Per region allocated/deallocated bitmap. */
bitmap_t bitmap[BITMAP_GROUPS_MAX];
};查看所有 runs:
(gdb) jeruns
*       run_addr        run_size    region_size    no_regions    no_free
----------------------------------------------------------------------------
1       0x7604902000    0x31000     -              -             -
2       0x7604933000    0x31000     -              -             -
3       0x7604964000    0x31000     -              -             -
4       0x7604995000    0x31000     -              -             -
5       0x7604a0d000    0x31000     -              -             -
6       0x7604a4f000    0x5000      0x1400         4             0
7       0x7604a54000    0x3000      0x600          8             0
8       0x7604a57000    0x5000      0x1400         4             0
9       0x7604a5c000    0x5000      0x1400         4             3
10      0x7604a77000    0x1000      0x800          2             0
11      0x7604a78000    0x31000     -              -             -
12      0x7604b0e000    0xb000      -              -             -
13      0x7604b1a000    0x3000      0x1800         2             1
14      0x7604b33000    0x3000      0x3000         1             0
15      0x7604b36000    0x3000      0x3000         1             0
16      0x7604b5f000    0xb000      -              -             -
17      0x7604b6b000    0x1000      0x1000         1             0
18      0x760560d000    0x29000     -              -             -
19      0x7605636000    0x29000     -              -             -
20      0x760565f000    0x29000     -              -             -
21      0x7605688000    0x5000      0x280          32            29
22      0x7605690000    0x8000      -              -             -
23      0x7605698000    0x5000      0xa00          8             6
24      0x76056b1000    0x3000      0x3000         1             0
25      0x76056b4000    0x3000      0x3000         1             0
26      0x76056b7000    0x3000      0x3000         1             0
....
可以看到,对应的 run指针()地址,当前 run 的 size,当前run中的 region数量,以及每个 region的size,和 处于 free状态的region数量。
runs是连续存储在 chunks中的:
(gdb) p /x 0x1400*4
$18 = 0x5000

(gdb) p /x 0x7604a4f000+0x5000
$20 = 0x7604a54000

(gdb) jechunk 0x7604a54000
This chunk belongs to the arena at 0x7623a00140.

addr            info                  size       usage
----------------------------------------------------------
0x7604a00000    headers               0xd000     -
0x7604a0d000    large run             0x31000    -
0x7604a3e000    unused range          0x73000    -
0x7604a4f000    small run (0x1400)    0x5000     4/4
0x7604a54000    small run (0x600)     0x3000     8/8
0x7604a57000    small run (0x1400)    0x5000     4/4
0x7604a5c000    small run (0x1400)    0x5000     1/4
0x7604a61000    unused range          0x20000    -
0x7604a77000    small run (0x800)     0x1000     2/2
0x7604a78000    large run             0x31000    -
0x7604aa9000    unused range          0xc7000    -
0x7604b0e000    large run             0xb000     -
0x7604b19000    unused range          0x17000    -
0x7604b1a000    small run (0x1800)    0x3000     1/2
0x7604b1d000    unused range          0x1c000    -
0x7604b33000    small run (0x3000)    0x3000     1/1
0x7604b36000    small run (0x3000)    0x3000     1/1
0x7604b39000    unused range          0x2c000    -
0x7604b5f000    large run             0xb000     -
0x7604b6a000    unused range          0x17000    -
0x7604b6b000    small run (0x1000)    0x1000     1/1
0x7604b6c000    unused range          0x96000    -
在chunk中,后续的每个run都是page size的整数倍,且每个run是紧邻的;
可以确认的是,runs的获取,是由 chunk获得的,使用 chunk及其成员 arena_chunk_map_bits_tmap_bits[1];
来获取的每个 chunk的 runs;
其中sizeof (arena_chunk_t) =128,而 header size = 0xd000(13个page = je_map_bias)
(gdb) p sizeof(arena_chunk_t)
$94 = 128

(gdb) p je_map_bias
$95 = 13
从上面数据可以看到,紧跟着 header后面就是 chunk中的连续的 runs,而 header 的大小是固定的:je_map_bias * PAGE_SIZE;
je_map_bias是根据chunk的大小 je_chunksize (je_chunk_npages*PAGE_SIZE),以及 arena_chunk_t计算出来的,
在 Android8.0的一个手机上:
(gdb) p /x je_chunksize
$117 = 0x200000
(gdb) p je_map_bias
$118 = 13
每个chunk最大是 2M,一个 chunk 中有 1 ~ N 个run,所以每个run最大是:
(gdb) p  je_chunksize-je_map_bias*4096
$123 = 2043904

(gdb) p je_arena_maxrun
$121 = 2043904
chunk与 runs的关系:
查看其中的一个 run 的bitmap:
(gdb) jeruns
*       run_addr        run_size    region_size    no_regions    no_free
----------------------------------------------------------------------------
1       0x7604902000    0x31000     -              -             -
...
32      0x76056c4000    0x1000      0x80           32            5
...

(gdb) p &((arena_run_t*)0x76056c4000)->bitmap
$261 = (bitmap_t (*)[8]) 0x76056c4008
可以看到,其 bitmap数组只有 8个元素,而它有 32 个 region;
(gdb) jerun 0x76056c4000
*     status    address         preview
----------------------------------------------------
0     used      0x76056c4000    0000003800000000
1     used      0x76056c4080    0000002200000000
2     used      0x76056c4100    0000441400000000
3     used      0x76056c4180    ff917754ff917701
4     used      0x76056c4200    ff917754ff917754
5     used      0x76056c4280    0e00000050221c13
6     used      0x76056c4300    0c00000000000000
7     used      0x76056c4380    ff917754ff917754
8     used      0x76056c4400    ff917754ff917701
9     used      0x76056c4480    0000223300000000
10    used      0x76056c4500    0000261400000000
11    used      0x76056c4580    00001d1600000000
12    used      0x76056c4600    0000457000000000
13    used      0x76056c4680    0020670962405c06
14    used      0x76056c4700    00003a4e00000000
15    used      0x76056c4780    0000002200000000
16    used      0x76056c4800    0000002200000000
17    used      0x76056c4880    0000003400000000
18    used      0x76056c4900    0000003400000000
19    used      0x76056c4980    0000002700000000
20    used      0x76056c4a00    0000003000000000
21    used      0x76056c4a80    00002d8000000000
22    used      0x76056c4b00    000064d900000000
23    used      0x76056c4b80    0000002200000000
24    used      0x76056c4c00    0000441400000000
25    free      0x76056c4c80    0000000006000002
26    free      0x76056c4d00    0000000006000002
27    free      0x76056c4d80    0000000006000002
28    free      0x76056c4e00    0000000006000002
29    free      0x76056c4e80    0000000006000002
30    used      0x76056c4f00    0000000006000002
31    used      0x76056c4f80    0000000006000002
看到 jerun从开始的位置就是属于第一个 region,header在哪里 ?
且查看 8.0 代码中runlayout,与上图有所不同:
2.3 查看 regions
(gdb) jeruns
*       run_addr        run_size    region_size    no_regions    no_free
----------------------------------------------------------------------------
1       0x7604902000    0x31000     -              -             -
2       0x7604933000    0x31000     -              -             -
3       0x7604964000    0x31000     -              -             -
4       0x7604995000    0x31000     -              -             -
5       0x7604a0d000    0x31000     -              -             -
6       0x7604a4f000    0x5000      0x1400         4             0
...

(gdb) jerun 0x7604a4f000
*    status    address         preview
---------------------------------------------------
0    used      0x7604a4f000    00000076268e01b8
1    used      0x7604a50400    00000076268e01b8
2    used      0x7604a51800    00000076268e01b8
3    used      0x7604a52c00    00000076268e01b8
可以看到,当前 run总共有 4个region,且都是使用状态,每个 region的 size 是 0x1400。
(gdb) jeregions 0x1400
*     run_addr        reg_size    run_size    usage
-------------------------------------------------------
1     0x7604a4f000    5120        0x5000      4/4
2     0x7604a57000    5120        0x5000      4/4
3     0x7604a5c000    5120        0x5000      1/4
4     0x76057bd000    5120        0x5000      2/4
5     0x7605877000    5120        0x5000      1/4
6     0x7605b2a000    5120        0x5000      2/4
7     0x7605b34000    5120        0x5000      4/4
8     0x7605b39000    5120        0x5000      3/4
9     0x7605be7000    5120        0x5000      2/4
10    0x7605bec000    5120        0x5000      4/4
11    0x7606187000    5120        0x5000      4/4
12    0x76062fd000    5120        0x5000      4/4
13    0x7606302000    5120        0x5000      4/4
14    0x76078bd000    5120        0x5000      4/4
15    0x76079da000    5120        0x5000      4/4
16    0x7607b60000    5120        0x5000      1/4
17    0x7607dea000    5120        0x5000      3/4
18    0x7613c84000    5120        0x5000      4/4
19    0x7613fb3000    5120        0x5000      4/4
20    0x7623973000    5120        0x5000      4/4

(gdb) p /x 5120
$213 = 0x1400
region大小为 0x1400的 run共有 21个,第一个 run就是我们刚刚查看的 那个run;
2.4 查看 bins
run是分配的执行者, 而分配的调度者是bin. 这个概念同dlmalloc中的bin是类似的,但jemalloc中bin要更复杂一些. 直白地说, 可以把bin看作non-full run的仓库, bin负责记录当前arena中某一个size class范围内所有non-full run的使用情况.
当有分配请求时, arena查找相应size class的bin, 找出可用于分配的run, 再由run分配region. 当然, 因为只有small region分配需要run, 所以bin也只对应small size class.
struct arena_bin_s {
malloc_mutex_t         lock;
arena_run_t            *runcur;
arena_run_tree_t       runs;
malloc_bin_stats_t     stats;
};
lock: 该lock同arena内部的lock不同, 主要负责保护current run. 而对于run本身的分配和释放还是需要依赖arena lock. 通常情况下, 获得bin lock的前提是获得arena lock, 但反之不成立.
runcur: 当前可用于分配的run, 一般情况下指向地址最低的non-full run, 同一时间一个bin只有一个current run用于分配.
runs: rb tree, 记录当前arena中该bin对应size class的所有non-full runs. 因为分配是通过current run完成的, 所以也相当于current run的仓库.
stats: 统计信息.
这段粗体,摘自 @杏林小轩 的博客;
查看bins:
(gdb) jebins
arena @ 0x7623a00140
index    addr            size      runcur
---------------------------------------------------
0        0x7623a00ac0    0x8       0x7623801c28
1        0x7623a00b68    0x10      0x7613408348
2        0x7623a00c10    0x20      0x7615e03b48
3        0x7623a00cb8    0x30      0x76134084c8
4        0x7623a00d60    0x40      0x7623803548
5        0x7623a00e08    0x50      0x7608408168
6        0x7623a00eb0    0x60      0x7607a088e8
7        0x7623a00f58    0x70      0x7607a071a8
8        0x7623a01000    0x80      0x7613c04328
9        0x7623a010a8    0xa0      0x762380b2e8
10       0x7623a01150    0xc0      0x7608405348
11       0x7623a011f8    0xe0      0x762380c368
12       0x7623a012a0    0x100     0x7608408888
13       0x7623a01348    0x140     0x761340b0a8
14       0x7623a013f0    0x180     0x7623802468
15       0x7623a01498    0x1c0     0x7623804b08
16       0x7623a01540    0x200     0x76084017a8
17       0x7623a015e8    0x280     0x7607a09368
18       0x7623a01690    0x300     0x7615e06428
19       0x7623a01738    0x380     0x7615e03de8
20       0x7623a017e0    -         -
21       0x7623a01888    0x500     0x7623806cc8
22       0x7623a01930    -         -
23       0x7623a019d8    0x700     0x7623802888
24       0x7623a01a80    0x800     0x7613409de8
25       0x7623a01b28    0xa00     0x7623807388
26       0x7623a01bd0    0xc00     0x7605a03248
27       0x7623a01c78    0xe00     0x760560b588
28       0x7623a01d20    0x1000    0x7613407028
29       0x7623a01dc8    0x1400    0x7607a08f48
30       0x7623a01e70    0x1800    0x76084044a8
31       0x7623a01f18    0x1c00    0x7608401808
32       0x7623a01fc0    0x2000    0x7608403f68
33       0x7623a02068    0x2800    0x7606207568
34       0x7623a02110    0x3000    0x7607a07f88
35       0x7623a021b8    -         -

arena @ 0x7623a8fc00
index    addr            size      runcur
---------------------------------------------------
0        0x7623a90580    0x8       0x7618a01868
1        0x7623a90628    0x10      0x7618a09008
2        0x7623a906d0    0x20      0x7618a04e08
3        0x7623a90778    0x30      0x7607804268
4        0x7623a90820    0x40      0x7607c0c8a8
5        0x7623a908c8    0x50      0x760780ac28
6        0x7623a90970    0x60      0x7618a021c8
7        0x7623a90a18    0x70      0x7618a022e8
8        0x7623a90ac0    0x80      0x7607807b08
9        0x7623a90b68    0xa0      0x7618a02588
10       0x7623a90c10    0xc0      0x7607c0c4e8
11       0x7623a90cb8    0xe0      0x7618a015c8
12       0x7623a90d60    0x100     0x7618a02048
13       0x7623a90e08    0x140     0x7607807568
14       0x7623a90eb0    0x180     0x7607802528
15       0x7623a90f58    0x1c0     0x7618a0a868
16       0x7623a91000    0x200     0x7618a03008
17       0x7623a910a8    0x280     0x7618a035a8
18       0x7623a91150    0x300     0x7607c0c068
19       0x7623a911f8    0x380     0x7607c0c608
20       0x7623a912a0    0x400     0x7607c0aa48
21       0x7623a91348    0x500     0x7618a05528
22       0x7623a913f0    -         -
23       0x7623a91498    0x700     0x7607805b88
24       0x7623a91540    0x800     0x76078035a8
25       0x7623a915e8    0xa00     0x76058015c8
26       0x7623a91690    -         -
27       0x7623a91738    0xe00     0x7618a09068
28       0x7623a917e0    -         -
29       0x7623a91888    0x1400    0x7607c0c308
30       0x7623a91930    0x1800    0x7607c0a808
31       0x7623a919d8    0x1c00    0x76078063c8
32       0x7623a91a80    -         -
33       0x7623a91b28    0x2800    0x7607804628
34       0x7623a91bd0    -         -
35       0x7623a91c78    -         -
可以看到,每个 arena都对应 36个 bin,对应 36种大小的 mem class;
而实际上,每个 bin都关联着多个 run,其中有的 run已经满了,有的 run还没满,有的 run还在使用中;
每个 run中的 region size是固定的,其实就是与 bin 的 mem class对应;
比如,bin[31] 对应的 mem class是 0x1c00 大小的内存,那么它关联的所有 run的 region size都是 0x1c00;
另外,有个 table:je_size2index_tab 是用来根据 mem size来查找其对应在 bins中的index的:
(gdb) p /d je_size2index_tab
$286 = {0, 1, 2, 2, 3, 3, 4, 4, 5, 5, 6, 6, 7, 7, 8, 8, 9, 9, 9, 9, 10, 10, 10, 10, 11, 11, 11, 11, 12, 12, 12, 12, 13, 13, 13, 13, 13, 13, 13, 13, 14, 14, 14, 14, 14, 14, 14, 14, 15, 15,
15, 15, 15, 15, 15, 15, 16, 16, 16, 16, 16, 16, 16, 16, 17 <repeats 16 times>, 18 <repeats 16 times>, 19 <repeats 16 times>, 20 <repeats 16 times>, 21 <repeats 32 times>,
22 <repeats 32 times>, 23 <repeats 32 times>, 24 <repeats 32 times>, 25 <repeats 64 times>, 26 <repeats 64 times>, 27 <repeats 64 times>, 28 <repeats 64 times>}
由于bins是被分成 Group的,除了0号bin之外, 相邻的4个bin属于同一group, 相邻的两个group,各自group内的相邻 bin 的差额是2倍;比如说:已知 group N内有四个bin: bin1,bin2,bin3,bin4,这4个bin的size差距都是 deltaA
group N+1内有4个bin:bin5,bin6,bin7,bin8,那么这4个 bin的size差距都是 deltaA * 2
group划分如下:
{0}, {1, 2, 3, 4}, {5, 6, 7, 8}, {9, 10, 11, 12}, {13, 14, 15, 16}, ...由于bin的最小 size是 8 byte,所以得到一个 mem地址,获取其 bin index可以这么计算:
bin_idx = (addr -1 ) >> 3
由于每个 bin 的取值范围不同,所以其对应的 index需要在 je_size2index_tab 中重复 (bin_range_size/8 ) 次,这样才能得到正确的 bin index,比如:
(gdb) jebins
arena @ 0x7623a00140
index    addr            size      runcur
---------------------------------------------------
0        0x7623a00ac0    0x8       0x7623801c28
1        0x7623a00b68    0x10      0x7613408348
2        0x7623a00c10    0x20      0x7615e03b48
3        0x7623a00cb8    0x30      0x76134084c8
4        0x7623a00d60    0x40      0x7623803548
5        0x7623a00e08    0x50      0x7608408168
6        0x7623a00eb0    0x60      0x7607a088e8
7        0x7623a00f58    0x70      0x7607a071a8
8        0x7623a01000    0x80      0x7613c04328
9        0x7623a010a8    0xa0      0x762380b2e8
10       0x7623a01150    0xc0      0x7608405348
11       0x7623a011f8    0xe0      0x762380c368
12       0x7623a012a0    0x100     0x7608408888
13       0x7623a01348    0x140     0x761340b0a8
14       0x7623a013f0    0x180     0x7623802468
15       0x7623a01498    0x1c0     0x7623804b08
第1组中,index1的bin,对应的取值范围是 0x8 ~ 0x10,它的范围只有8 byte,所以 index1 在 je_size2index_tab 中出现1次即可;
第1组中,index2的bin,对应的取值范围是
0x10 ~ 0x20,它的范围有16 byte,所以 index1 在 je_size2index_tab 中出现 16/8 = 2次;
第3组中,index9的bin,对应的取值范围是 0xa0 ~ 0x80,它的范围有32 byte,所以 index9 在 je_size2index_tab
中出现 32/8 = 4次;
依次类推即可;
这样,我们就可以很快的为一个请求的 size找到其合适的 bin 去分配内存了:
比如 arenas[idx]->bins[ (size-1) >> 3] 即是 匹配 size的 bin,在该 bin上挂的 runs中给其分配 region 即可;
2.5 tcache
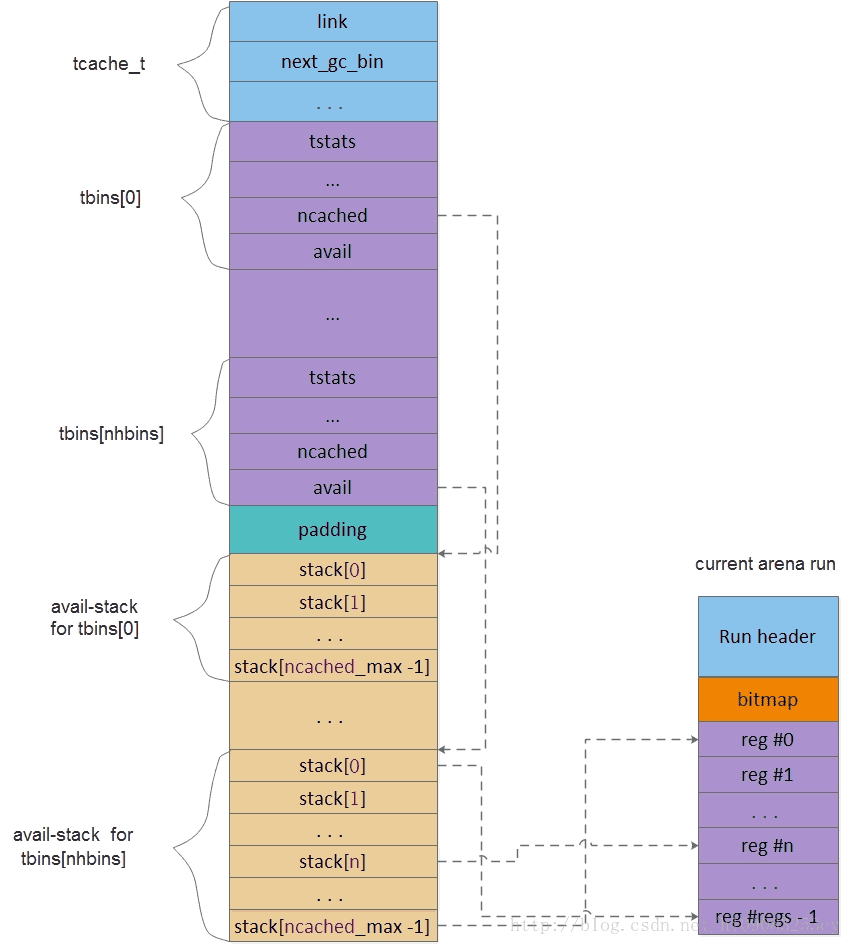
TLS/TSD是另一种针对多线程优化使用的分配技术, jemalloc中称为tcache. tcache解决的是同一cpu core下不同线程对heap的竞争. 通过为每个线程指定专属分配区域,来减小线程间的干扰. 但显然这种方法会增大整体内存消耗量. 为了减小副作用,jemalloc将tcache设计成一个bookkeeping结构, 在tcache中保存的仅仅是指向外部region的指针, region对象仍然位于各个run当中.换句话说, 如果一个region被tcache记录了, 那么从run的角度看, 它就已经被分配了.
tcache的内容如下,
struct tcache_s {
ql_elm(tcache_t) link;
uint64_t           prof_accumbytes;
arena_t            *arena;
unsigned           ev_cnt;
unsigned           next_gc_bin;
tcache_bin_t      tbins[1];
};
link: 链接节点, 用于将同一个arena下的所有tcache链接起来.
prof_accumbytes: memory profile相关.
arena: 该tcache所属的arena指针.
ev_cnt: 是tcache内部的一个周期计数器. 每当tcache执行一次分配或释放时, ev_cnt会记录一次. 直到周期到来, jemalloc会执行一次incremental gc.这里的gc会清理tcache中多余的region, 将它们释放掉. 尽管这不意味着系统内存会获得释放, 但可以解放更多的region交给其他更饥饿的线程以分配.
next_gc_bin: 指向下一次gc的binidx. tcache gc按照一周期清理一个bin执行.
tbins: tcache bin数组. 同样外挂在tcache后面.
同arena bin类似, tcache同样有tcache_bin_t和tcache_bin_info_t.tcache_bin_t作用类似于arena bin, 但其结构要比后者更简单. 准确的说, tcache bin并没有分配调度的功能, 而仅起到记录作用. 其内部通过一个stack记录指向外部arena run中的region指针. 而一旦region被cache到tbins内,
就不能再被其他任何线程所使用, 尽管它可能甚至与其他线程tcache中记录的region位于同一个arena run中.
tcache bin结构如下,
struct tcache_bin_s {
tcache_bin_stats_t tstats;
int                   low_water;
unsigned             lg_fill_div;
unsigned             ncached;
void                  **avail;
}
tstats: tcache bin内部统计.
low_water: 记录两次gc间tcache内部使用的最低水线. 该数值与下一次gc时尝试释放的region数量有关. 释放量相当于low water数值的3/4.
lg_fill_div: 用作tcache refill时作为除数. 当tcache耗尽时, 会请求arena run进行refill. 但refill不会一次性灌满tcache, 而是依照其最大容量缩小2^lg_fill_div的倍数. 该数值同low_water一样是动态的, 两者互相配合确保tcache处于一个合理的充满度.
ncached: 指当前缓存的region数量, 同时也代表栈顶index.
avail: 保存region指针的stack, 称为avail-stack.
tcache_bin_info_t保存tcache bin的静态信息. 其本身只保存了tcache max容量. 该数值是在tcache boot时根据相对应的arena bin的nregs决定的. 通常等于nregs的二倍, 但不得超过TCACHE_NSLOTS_SMALL_MAX. 该数值默认为200, 但在android中大大提升了该限制, small bins不得超过8, large bins则为16.
struct tcache_bin_info_s {
unsigned    ncached_max;
};
tcache layout如下,tcache的调试目前还没有搞定,还无法从 gdb中查看 tcache,待调查;
3.Jemalloc分配与释放
Jemalloc的分配与释放待学习,分配路径,参考下面 Jemalloc的框架图,可以推测一二:1.优先 tcache,根据 tcache_bin查找合适的run,找到空闲的 region进行分配
2.继而选择一个 arena,然后根据bins,选择对应 bins上挂着的run,再从run中选取合适的 region分配
当然遇到分配过程中的某一个失败时,可以选取一个 arena,进行分配新的 chunk,run,region;

相关文章推荐
- VS使用命令行选项查看对象的内存布局
- VS2008使用命令行选项查看对象的内存布局
- 使用 CL 编译器选项查看 C++ 类内存布局 (转载)http://blog.csdn.net/zhangcunli/archive/2009/10/23/4720781.aspx
- 使用CL编译器选项查看C++类内存布局----转
- [C++]VS2008使用命令行选项查看对象的内存布局
- 使用sos查看.NET对象内存布局
- 使用 CL 编译器选项查看 C++ 类内存布局
- 使用 CL 编译器选项查看 C++ 类内存布局--转
- Linux Debugging(四): 使用GDB来理解C++ 对象的内存布局(多重继承,虚继承)
- Linux Debugging(四): 使用GDB来理解C++ 对象的内存布局(多重继承,虚继承)
- 使用 gdb查看内存
- 使用 CL 编译器选项查看 C++ 类内存布局--转
- [GDB]使用gdb查看内存
- VS2008使用命令行选项查看对象的内存布局
- 如何使用VS2008命令行选项查看对象的内存布局 ?
- [C++]VS2008使用命令行选项查看对象的内存布局
- 使用 CL 编译器选项查看 C++ 类内存布局--转
- [C++]VS2008使用命令行选项查看对象的内存布局
- 查看虚函数表和类内存布局,以及使用MSVC与GCC hack验证
- 文章翻译——使用 GNU 的 GDB调试器,内存布局和栈——01