Java - Java Garbage Collection Monitoring and Analysis
2018-01-17 11:07
507 查看
In this Java garbage collection tutorial series let us look about the tools available for garbage collection monitoring and analysis. Then use a tool and monitor an example Java application for garbage collection
process. If you are a beginner it is better for you to go through this series of tutorials. You can start with introduction
for Java garbage collection.
Following are some of the tools available. Each of these following tools have their own advantages and disadvantages. We can improve performance of an application by choosing the right tool and doing the analysis
in an organized manner. For this tutorial, let us go with the Java VisualVM.
Java VisualVM
Naarad
GCViewer
IBM Pattern Modeling and Analysis Tool for Java Garbage Collector
HPjmeter
IBM Monitoring and Diagnostic Tools for Java – Garbage Collection and Memory
Visualizer
Verbose GC Analyzer
Java VisualVM is available with the Java SE SDK installation for free. Just have a look at the bin folder of your Java JDK installation.
tools available along with the javac and java tools.
Java VisualVM provides information about running Java applications with a visual interface. It is many tool bundled into one. Tools like JConsole, jstat, jinfo, jstack, and jmap are now part of Java VisualVM.
Java VisualVM can be used to
generate and analyze heap memory dumps
view and operate on MBeans
monitor garbage collection
memory and CPU profiling
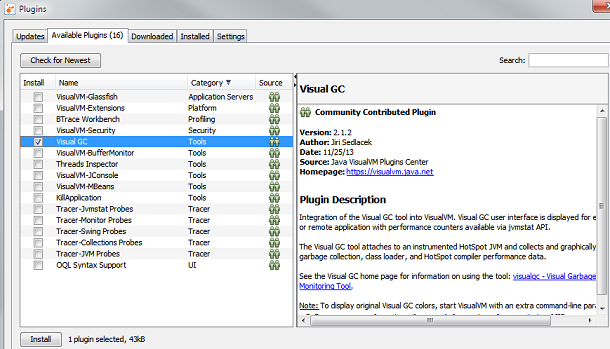
We need to install a visual GC plugin have a nice and worthy visual feel of the Java GC process.
Now its time to monitor the garbage
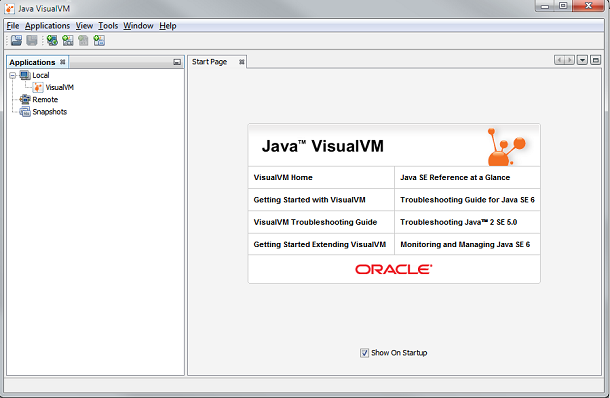
collection process. Start your Java application and it will be auto detected and shown in the Java VisualVM interface. In the left side “Applications” pane under the “Local” node, all the locally running Java applications will be listed.
Java VisualVM is a Java application and so it will also me listed in it. For tutorial purpose we will monitory the GC process for the VisualVM application itself.
Double click the VisualVM icon shown below the “Local” node.
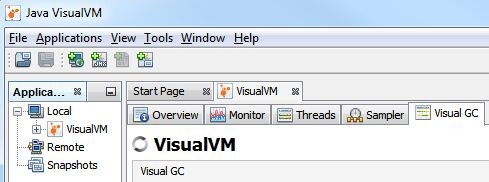
Now the application monitoring pane is open on the right side. There are different tabs to show each of the performance related monitoring aspects of the application. As of now our interest is on “Visual GC”
and lets click it.
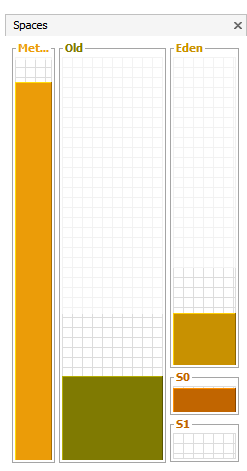
Above image show the memory spaces utilization for Old, Eden, S0 and S1 spaces. Following graphs shows each segment wise detail allocation and de-allocation of memory space. It keeps updating at defined refresh
rate.
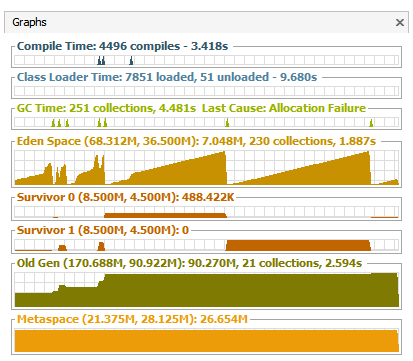
The above shown graphs are for a normally behaving application. When there is a memory leak or any abnormal behaviour it will explicitly evident from the graph itself. To the least we can understand that there
is an issue related to object memory allocation and garbage collection. Then with the help of other tabs like “Threads” and with Thread Dump we can narrow down the issue.
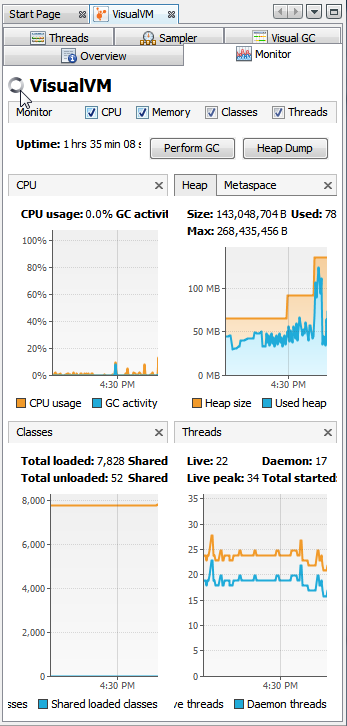
In the “Monitor” tab we can monitor overall Heap memory utilization as a timer series graph. We have got “Perform GC” button to initiate the garbage collection process.
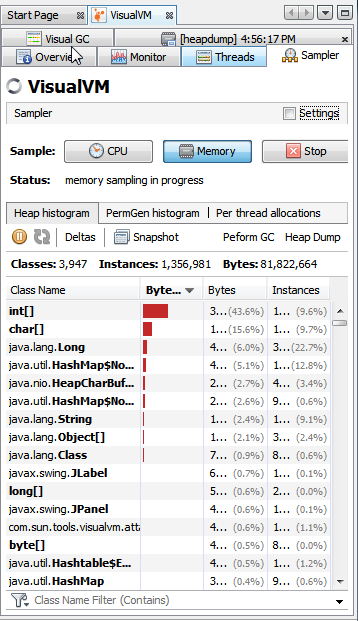
In the “Sampler” tab we can start the memory and CPU profiling process. It will show detailed live report for each instance wise utilization. It will help to nail down the performance problem.
process. If you are a beginner it is better for you to go through this series of tutorials. You can start with introduction
for Java garbage collection.
Java Garbage collection monitoring and analysis tools
Following are some of the tools available. Each of these following tools have their own advantages and disadvantages. We can improve performance of an application by choosing the right tool and doing the analysisin an organized manner. For this tutorial, let us go with the Java VisualVM.
Java VisualVM
Naarad
GCViewer
IBM Pattern Modeling and Analysis Tool for Java Garbage Collector
HPjmeter
IBM Monitoring and Diagnostic Tools for Java – Garbage Collection and Memory
Visualizer
Verbose GC Analyzer
Java VisualVM
Java VisualVM is available with the Java SE SDK installation for free. Just have a look at the bin folder of your Java JDK installation. \Java\jdk1.8.0\binis the path. There are many other
tools available along with the javac and java tools.
jvisualvmis one among them.
Java VisualVM provides information about running Java applications with a visual interface. It is many tool bundled into one. Tools like JConsole, jstat, jinfo, jstack, and jmap are now part of Java VisualVM.
Java VisualVM can be used to
generate and analyze heap memory dumps
view and operate on MBeans
monitor garbage collection
memory and CPU profiling
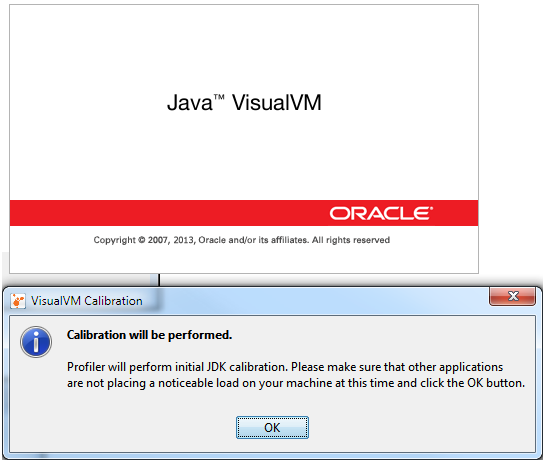
1. Launch VisualVM
jvisualvmis available in bin fold of JDK.
2. Install Visual GC Plugin
We need to install a visual GC plugin have a nice and worthy visual feel of the Java GC process.
3. Monitor GC
Now its time to monitor the garbagecollection process. Start your Java application and it will be auto detected and shown in the Java VisualVM interface. In the left side “Applications” pane under the “Local” node, all the locally running Java applications will be listed.
Java VisualVM is a Java application and so it will also me listed in it. For tutorial purpose we will monitory the GC process for the VisualVM application itself.
Double click the VisualVM icon shown below the “Local” node.
Now the application monitoring pane is open on the right side. There are different tabs to show each of the performance related monitoring aspects of the application. As of now our interest is on “Visual GC”
and lets click it.
Above image show the memory spaces utilization for Old, Eden, S0 and S1 spaces. Following graphs shows each segment wise detail allocation and de-allocation of memory space. It keeps updating at defined refresh
rate.
The above shown graphs are for a normally behaving application. When there is a memory leak or any abnormal behaviour it will explicitly evident from the graph itself. To the least we can understand that there
is an issue related to object memory allocation and garbage collection. Then with the help of other tabs like “Threads” and with Thread Dump we can narrow down the issue.
In the “Monitor” tab we can monitor overall Heap memory utilization as a timer series graph. We have got “Perform GC” button to initiate the garbage collection process.
In the “Sampler” tab we can start the memory and CPU profiling process. It will show detailed live report for each instance wise utilization. It will help to nail down the performance problem.

相关文章推荐
- Java Garbage Collection Monitoring and Analysis
- Java Garbage Collection Monitoring and Analysis
- Java (JVM) Memory Model and Garbage Collection Monitoring Tuning
- Java垃圾回收机制四 Monitoring and Analyzing Java Garbage Collection
- Java™ Garbage CollectionStatistical Analysis
- GC调优方案,步骤二:使用工具[IBM Pattern Modeling and Analysis Tool for Java Garbage Collector]分析gc信息
- 为什么很少有Java程序员精通Multi-threading, Concurrency and Garbage Collection?
- Java Memory Architecture (Model), Garbage Collection and Memory Leaks
- Garbage Collection Optimization for High-Throughput and Low-Latency Java Applications--转载
- java基础——finalize() and Garbage Collection
- GC (二)Garbage Collection in Java
- How to Monitor Java Garbage Collection
- Notes: Garbage Collection in Java(Java的自动垃圾回收机制)
- java jconsole命令(Java Monitoring and Management Console)
- Java中的垃圾回收是如何工作的?(How Garbage Collection works in Java)
- Java Garbage Collection (GC) Tuning
- 细述 Java垃圾回收机制→How Java Garbage Collection Works?
- [翻译]Java Garbage Collection Basics Java 垃圾回收基础 目录
- [Clojure] Data Collection and Data Analysis on the music of www.xiami.com - Part 4
- How to Tune Java Garbage Collection