phpunit 单元测试框架-代码覆盖率
2018-01-03 17:07
726 查看
"phpize not found" 的解决办法: apt-get install php5-dev
http://jeffreysambells.com/2010/04/08/reporting-code-coverage-with-phpunit-and-xdebug
--------------------------------------------------------------------------------------
As a follow up to my previous post about debugging php I slightly changed the process and installed XDebug instead of Zend Debugger. This was mainly so that I could generate nice code coverage reports for my unit tests–and it was easy to setup.
To install xdebug all I had to do was:
and then I edit my previous ini file to use xdebug instead:
The only other change was that I selected
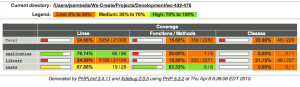
With XDebug, the debugging in Zend Studio is the same however I can now generate nice code coverage reports for my PHPUnit tests:
The report lets you view each individual file that was included in the execution:
Note: if you’re using this you may want to increase the memory assigned to your command line PHP ini file. The report generation is a memory hog so I bumped mine to 512MB just to be safe.
http://jeffreysambells.com/2010/04/08/reporting-code-coverage-with-phpunit-and-xdebug
--------------------------------------------------------------------------------------
As a follow up to my previous post about debugging php I slightly changed the process and installed XDebug instead of Zend Debugger. This was mainly so that I could generate nice code coverage reports for my unit tests–and it was easy to setup.
To install xdebug all I had to do was:
% port install php5-xdebug
and then I edit my previous ini file to use xdebug instead:
zend_extension=/opt/local/lib/php/extensions/no-debug-non-zts-20090626/xdebug.so
xdebug.remote_enable=on
xdebug.default_enable=on
xdebug.remote_autostart=on
xdebug.remote_host=127.0.0.1,192.168.0/24,10.37.129.2,10.211.55.2
The only other change was that I selected
XDebuginstead of
Zend Debuggeras the engine in the debug profile I had previously setup in Zend Studio.
With XDebug, the debugging in Zend Studio is the same however I can now generate nice code coverage reports for my PHPUnit tests:
phpunit --coverage-html ./report MyTests.php
The report lets you view each individual file that was included in the execution:

Note: if you’re using this you may want to increase the memory assigned to your command line PHP ini file. The report generation is a memory hog so I bumped mine to 512MB just to be safe.

相关文章推荐
- Java单元测试(Junit+Mock+代码覆盖率)
- 一个通用的单元测试框架的思考和设计08-实现篇-在testcase代码中执行sql语句
- android gradle + junit +jacoco +sonarscaner(sonarrunner) 获取单元测试覆盖率以及代码质量
- 在撩单元测试代码覆盖率
- Jenkins构建Android项目持续集成之单元测试及代码覆盖率
- 单元测试代码覆盖率浅谈
- 三行代码实现C语言单元测试框架
- 一个通用的单元测试框架的思考和设计08-实现篇-在testcase代码中执行sql语句
- Java开发工具IntelliJ IDEA单元测试和代码覆盖率图解
- Java单元测试(Junit+Mock+代码覆盖率)
- Jenkins构建Android项目持续集成之单元测试及代码覆盖率
- php单元测试-phpunit,以及thinkphp框架集成的单元测试下载
- 三行代码实现C语言单元测试框架
- Jenkins构建Android项目持续集成之单元测试及代码覆盖率
- Java开发工具IntelliJ IDEA单元测试和代码覆盖率图解
- maven中实现代码单元测试覆盖率统计
- PHP单元测试框架PHPUnit的使用
- Java单元测试(Junit+Mock+代码覆盖率)
- PHP单元测试框架 - PHPUnit介绍