LLDB调试工具简单使用
2017-11-28 00:00
387 查看
LLDB简介
LLDB是开源的, 内置于Xcode的Debugger 其可以安装C++或者Python插件. LLDB绑定在Xcode内部, 存在于主窗口底部的控制台中. 平时用Xcode调试程序, 实际走的都是LLDB. 熟练使用LLDB, 可以让你debug事半功倍.
1.Xcode中的LLDB控制台常用的快捷键
2.唯一匹配原则
LLDB命令遵循唯一匹配原则:加入前n个字母已经能够确定唯一匹配到一个命令, 则只写前n个字母等效于写下完整的命令
3.~/.lldbinit
LLDB有一个启动时加载的文件’~/.lldbinit’, 每次启动都会加载. 所以一些初始化的事我们可以统一放在~/.lldbinit中, 比如给命令定义别名等. 但是由于这时候程序还没有真正运行, 也有部分操作在这里无法运行, 比如设置断点.
4.LLDB命令, expression
expression命令的作用是执行一个表达式, 并将结果输出. 说expression是LLDB中最重要的命令都不为过. 因为它能实现两个功能:
1, 执行某个表达式. 我们在代码运行过程中, 可以通过执行某个表达式来动态的改变程序的运行轨迹. 比如想要突然改掉view的颜色, 看看效果, 不必重写代码, 重新run. 只需要暂停一下, 用expression改变颜色, 再刷新一下界面就能看到效果.
当然, 也可以修改某个变量的值.
```
//改变颜色
expression — self.view.backgroundColor = UIColor.red
//刷新界面
expression — (void)CATransaction.flush (e (void)[CATransaction flush] ) //刷新UI
```
2,将返回值输出. 也就是说我们可以用expression打印东西. 比如:
```
expression — self.view
```
5.p, po, print, call
一般情况下, 我们直接使用expression还是比较少的,更多时候我们用的是p,print,call.这三个命令其实都是`expression -`的别名(`-`表示不再接受命令选项).
oc中所有对象都是用指针表示的, 所以一般打印的时候, 打印出来的都是对象的指针, 而不是对象本身, 如果我们想打印对象. 则需要使用`-0`. 为了使用方便, lldb为`expression -0 -`定义了一个别名: po
```
1.print 打印某个东西, 可以是变量, 也可以是表达式.
2.p 可以看作是print的简写.
3.call 调用某个方法.
4.po 打印对象
```
还有很多其他的命令选项, 一般都用的比较少, 可以通过`help expression`命令查看.
6.c, n, s, finish
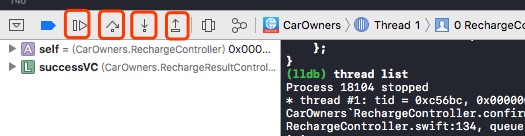
1.c/continue/thread continue: 这三个命令都等同于上图第一个按钮, 表示继续执行.
2.n/next/thread step-over:等同于上图第二个按钮,单步执行.
3.s/step/thread strp-in:等同于上图第三个按钮, 表示继续执行.
4.finish/step-out:等同于第四个按钮,表示直接走完当前方法,返回到上层frame.
7.thread相关命令
thread backtrace: 作用是将线程的堆栈打印出来.
当程序发生crash时候, 我们可以用`thread backtrace`来查看堆栈调用情况.
lldb专门为backtrace定义专门的别名`bt`, 他的效果和`thread backtrace`相同.
thread return: 接受一个表达式, 调用命令之后从当前的frame返回表达式的值.
比如debug时候, 也许会因为各种原因不想让代码执行某个方法, 或者要直接返回一个想要的值. 这个之后可以使用`thread return`直接返回想要的值.
其它thread不常用的命令:
1.thread list: 列出所有的线程
2.thread select: 选择某个线程
3.thread until: 传入一个line的参数, 让程序执行到这行的时候暂停.
4.thread info: 输出当前现成的信息
8.frame命令
随便打个断点, 在控制台上输入`bt`, 可以打印出所有的frame. 如果仔细观察, 这些frame和左边的堆栈信息是一致的, 平时我们看到的左边的堆栈信息就是frame.
frame的子命令如下
```
The following subcommands are supported:
info -- List information about the current stack frame in the current
thread.
select -- Select the current stack frame by index from within the
current thread (see 'thread backtrace’., 列出所有的frame)
variable -- Show variables for the current stack frame. Defaults to all
arguments and local variables in scope. Names of argument,
local, file static and file global variables can be
specified. Children of aggregate variables can be specified
such as 'var->child.x'.
````
9.breakpoint命令
断点命令. 能做的事情如下所示, 是非常强大的.
```
The following subcommands are supported:
clear -- Delete or disable breakpoints matching the specified source
file and line.
command -- Commands for adding, removing and listing LLDB commands
executed when a breakpoint is hit.
delete -- Delete the specified breakpoint(s). If no breakpoints are
specified, delete them all.
disable -- Disable the specified breakpoint(s) without deleting them. If
none are specified, disable all breakpoints.
enable -- Enable the specified disabled breakpoint(s). If no breakpoints
are specified, enable all of them.
list -- List some or all breakpoints at configurable levels of detail.
modify -- Modify the options on a breakpoint or set of breakpoints in
the executable. If no breakpoint is specified, acts on the
last created breakpoint. With the exception of -e, -d and -i,
passing an empty argument clears the modification.
name -- Commands to manage name tags for breakpoints
read -- Read and set the breakpoints previously saved to a file with
"breakpoint write".
set -- Sets a breakpoint or set of breakpoints in the executable.
write -- Write the breakpoints listed to a file that can be read in
with "breakpoint read". If given no arguments, writes all
breakpoints.
示例:
breakpoint list: 列出所有的断点;
breakpoint disable 2: 让标记是2的断点不可用
breakpoint enable 2: 让标记是2的断点可用
breakpoint delete 2: 删除标记是2的断点
```
watchpoint
breakpoint有一个孪生兄弟watchpoint。如果说breakpoint是对方法生效的断点,watchpoint就是对地址生效的断点
如果我们想要知道某个属性什么时候被篡改了,我们该怎么办呢?有人可能会说对setter方法打个断点不就行了么?但是如果更改的时候没调用setter方法呢? 这时候最好的办法就是用watchpoint。我们可以用他观察这个属性的地址。如果地址里面的东西改变了,就让程序中断.
可以将断点打在变量的定义上或者使用lldb工具设置都行.
10.target命令
对于target命令, 我们用的最多的就是`target modules lookup`. 由于LLDB给target modules取了个别名叫`image`, 所以这个命令我们可以写成`image lookup`
1> 如果我们有一个地址, 想知道这个地址对应的具体的文件位置, 可以使用`image lookup -address [addr]`(简写成image lookup -a).
2> 如果我们想查找某个方法在哪个文件里面包含, 可以使用`image lookup -name`(简写:image lookup -n [方法名字]).
3> 如果想查看一个类型相关的方法属性等等信息, 可以使用`image lookup –type`命令.
4> 用lldb debug, 大多时候需要让程序stop, 不管是breakpoint还是watchpoint. target stop-hook命令就是让你可以在每次stop的时候去执行一些命令.
例如: target stop-hook add -o "frame variable" 添加后, 每次只执行到断点都会打印frame所有的变量
```
//stop-hook支持以下几个命令:
The following subcommands are supported:
add -- Add a hook to be executed when the target stops.
delete -- Delete a stop-hook.
disable -- Disable a stop-hook.
enable -- Enable a stop-hook.
list -- List all stop-hooks.
```
11.help & apropos
lldb提供了两个查找命令的命令: help和apropos
1.直接在lldb中输入help, 可以查看所有的lldb命令.
2.如果想查看某个命令的详细用法, 可以使用help e.g(如: help target)
3.有时候我们并不能完全记得某个命令, 如果只记得某个命令中某个关键字, 这时候可以使用apropos搜索相关的命令信息.
LLDB是开源的, 内置于Xcode的Debugger 其可以安装C++或者Python插件. LLDB绑定在Xcode内部, 存在于主窗口底部的控制台中. 平时用Xcode调试程序, 实际走的都是LLDB. 熟练使用LLDB, 可以让你debug事半功倍.
1.Xcode中的LLDB控制台常用的快捷键
| 快捷键功能 | 命令 |
| 暂停/继续 | cmd + ctrl + Y |
| 控制台显示/隐藏 | cmd + Y |
| 光标切换到控制台 | cmd + shift + C |
| 清空控制台 | cmd + K |
| step over | F6 |
| step into | F7 |
| step out | F8 |
LLDB命令遵循唯一匹配原则:加入前n个字母已经能够确定唯一匹配到一个命令, 则只写前n个字母等效于写下完整的命令
3.~/.lldbinit
LLDB有一个启动时加载的文件’~/.lldbinit’, 每次启动都会加载. 所以一些初始化的事我们可以统一放在~/.lldbinit中, 比如给命令定义别名等. 但是由于这时候程序还没有真正运行, 也有部分操作在这里无法运行, 比如设置断点.
4.LLDB命令, expression
expression命令的作用是执行一个表达式, 并将结果输出. 说expression是LLDB中最重要的命令都不为过. 因为它能实现两个功能:
1, 执行某个表达式. 我们在代码运行过程中, 可以通过执行某个表达式来动态的改变程序的运行轨迹. 比如想要突然改掉view的颜色, 看看效果, 不必重写代码, 重新run. 只需要暂停一下, 用expression改变颜色, 再刷新一下界面就能看到效果.
当然, 也可以修改某个变量的值.
```
//改变颜色
expression — self.view.backgroundColor = UIColor.red
//刷新界面
expression — (void)CATransaction.flush (e (void)[CATransaction flush] ) //刷新UI
```
2,将返回值输出. 也就是说我们可以用expression打印东西. 比如:
```
expression — self.view
```
5.p, po, print, call
一般情况下, 我们直接使用expression还是比较少的,更多时候我们用的是p,print,call.这三个命令其实都是`expression -`的别名(`-`表示不再接受命令选项).
oc中所有对象都是用指针表示的, 所以一般打印的时候, 打印出来的都是对象的指针, 而不是对象本身, 如果我们想打印对象. 则需要使用`-0`. 为了使用方便, lldb为`expression -0 -`定义了一个别名: po
```
1.print 打印某个东西, 可以是变量, 也可以是表达式.
2.p 可以看作是print的简写.
3.call 调用某个方法.
4.po 打印对象
```
还有很多其他的命令选项, 一般都用的比较少, 可以通过`help expression`命令查看.
6.c, n, s, finish
1.c/continue/thread continue: 这三个命令都等同于上图第一个按钮, 表示继续执行.
2.n/next/thread step-over:等同于上图第二个按钮,单步执行.
3.s/step/thread strp-in:等同于上图第三个按钮, 表示继续执行.
4.finish/step-out:等同于第四个按钮,表示直接走完当前方法,返回到上层frame.
7.thread相关命令
thread backtrace: 作用是将线程的堆栈打印出来.
当程序发生crash时候, 我们可以用`thread backtrace`来查看堆栈调用情况.
lldb专门为backtrace定义专门的别名`bt`, 他的效果和`thread backtrace`相同.
thread return: 接受一个表达式, 调用命令之后从当前的frame返回表达式的值.
比如debug时候, 也许会因为各种原因不想让代码执行某个方法, 或者要直接返回一个想要的值. 这个之后可以使用`thread return`直接返回想要的值.
其它thread不常用的命令:
1.thread list: 列出所有的线程
2.thread select: 选择某个线程
3.thread until: 传入一个line的参数, 让程序执行到这行的时候暂停.
4.thread info: 输出当前现成的信息
8.frame命令
随便打个断点, 在控制台上输入`bt`, 可以打印出所有的frame. 如果仔细观察, 这些frame和左边的堆栈信息是一致的, 平时我们看到的左边的堆栈信息就是frame.
frame的子命令如下
```
The following subcommands are supported:
info -- List information about the current stack frame in the current
thread.
select -- Select the current stack frame by index from within the
current thread (see 'thread backtrace’., 列出所有的frame)
variable -- Show variables for the current stack frame. Defaults to all
arguments and local variables in scope. Names of argument,
local, file static and file global variables can be
specified. Children of aggregate variables can be specified
such as 'var->child.x'.
````
9.breakpoint命令
断点命令. 能做的事情如下所示, 是非常强大的.
```
The following subcommands are supported:
clear -- Delete or disable breakpoints matching the specified source
file and line.
command -- Commands for adding, removing and listing LLDB commands
executed when a breakpoint is hit.
delete -- Delete the specified breakpoint(s). If no breakpoints are
specified, delete them all.
disable -- Disable the specified breakpoint(s) without deleting them. If
none are specified, disable all breakpoints.
enable -- Enable the specified disabled breakpoint(s). If no breakpoints
are specified, enable all of them.
list -- List some or all breakpoints at configurable levels of detail.
modify -- Modify the options on a breakpoint or set of breakpoints in
the executable. If no breakpoint is specified, acts on the
last created breakpoint. With the exception of -e, -d and -i,
passing an empty argument clears the modification.
name -- Commands to manage name tags for breakpoints
read -- Read and set the breakpoints previously saved to a file with
"breakpoint write".
set -- Sets a breakpoint or set of breakpoints in the executable.
write -- Write the breakpoints listed to a file that can be read in
with "breakpoint read". If given no arguments, writes all
breakpoints.
示例:
breakpoint list: 列出所有的断点;
breakpoint disable 2: 让标记是2的断点不可用
breakpoint enable 2: 让标记是2的断点可用
breakpoint delete 2: 删除标记是2的断点
```
watchpoint
breakpoint有一个孪生兄弟watchpoint。如果说breakpoint是对方法生效的断点,watchpoint就是对地址生效的断点
如果我们想要知道某个属性什么时候被篡改了,我们该怎么办呢?有人可能会说对setter方法打个断点不就行了么?但是如果更改的时候没调用setter方法呢? 这时候最好的办法就是用watchpoint。我们可以用他观察这个属性的地址。如果地址里面的东西改变了,就让程序中断.
可以将断点打在变量的定义上或者使用lldb工具设置都行.
10.target命令
对于target命令, 我们用的最多的就是`target modules lookup`. 由于LLDB给target modules取了个别名叫`image`, 所以这个命令我们可以写成`image lookup`
1> 如果我们有一个地址, 想知道这个地址对应的具体的文件位置, 可以使用`image lookup -address [addr]`(简写成image lookup -a).
2> 如果我们想查找某个方法在哪个文件里面包含, 可以使用`image lookup -name`(简写:image lookup -n [方法名字]).
3> 如果想查看一个类型相关的方法属性等等信息, 可以使用`image lookup –type`命令.
4> 用lldb debug, 大多时候需要让程序stop, 不管是breakpoint还是watchpoint. target stop-hook命令就是让你可以在每次stop的时候去执行一些命令.
例如: target stop-hook add -o "frame variable" 添加后, 每次只执行到断点都会打印frame所有的变量
```
//stop-hook支持以下几个命令:
The following subcommands are supported:
add -- Add a hook to be executed when the target stops.
delete -- Delete a stop-hook.
disable -- Disable a stop-hook.
enable -- Enable a stop-hook.
list -- List all stop-hooks.
```
11.help & apropos
lldb提供了两个查找命令的命令: help和apropos
1.直接在lldb中输入help, 可以查看所有的lldb命令.
2.如果想查看某个命令的详细用法, 可以使用help e.g(如: help target)
3.有时候我们并不能完全记得某个命令, 如果只记得某个命令中某个关键字, 这时候可以使用apropos搜索相关的命令信息.

相关文章推荐
- facebook的Android调试工具Stetho的简单使用
- 菜鸟学习历程【2】vim的简单操作、GCC工具链、make和Makefile、GDB调试工具、Shell使用基础
- gdb调试工具的简单使用
- 使用RXTX实现简单串口通信调试工具
- PHP 安装包 VC9 VC6 区别及Thread Safe和Non Thread Safe版本---PHP性能调试工具xdebug的简单使用
- iOS-LLDB调试工具的基本使用
- http协议调试代理工具Fiddler的简单安装和使用
- JAR工具的简单使用
- 数据自动生成工具 DataFactory 的简单使用
- 一个简单实用的ASP调试函数和使用方法
- 数据自动生成工具 DataFactory 的简单使用
- VMKD windbg+vmWare进行两机调试的加速工具的介绍及原理简单分析
- 版本控制工具git的简单使用
- 使用单元测试工具TestDriven.NET调试程序
- XNA Game Studio是一套有着强大功能和简单界面的游戏制作平台,游戏开发商和游戏玩家都可以使用这套工具开发针对Windows XP以及Xbox360的游戏,XNA Game Studio分为两种版本,一种是面向初学者的EXPRESS版本,还有一种
- 推荐SQLPrompt3 -简单破解无限期的使用这款很不错的SQL查询分析工具
- 使用单元测试工具TestDriven.NET调试程序
- 简单介绍vss工具command操作使用
- 防U盘病毒——简单办法(不使用额外工具)
- gdb的简单使用和gdb+gdbserver方式进行ARM程序调试