matplotlib 设置坐标轴显示内容
2017-11-12 10:32
603 查看
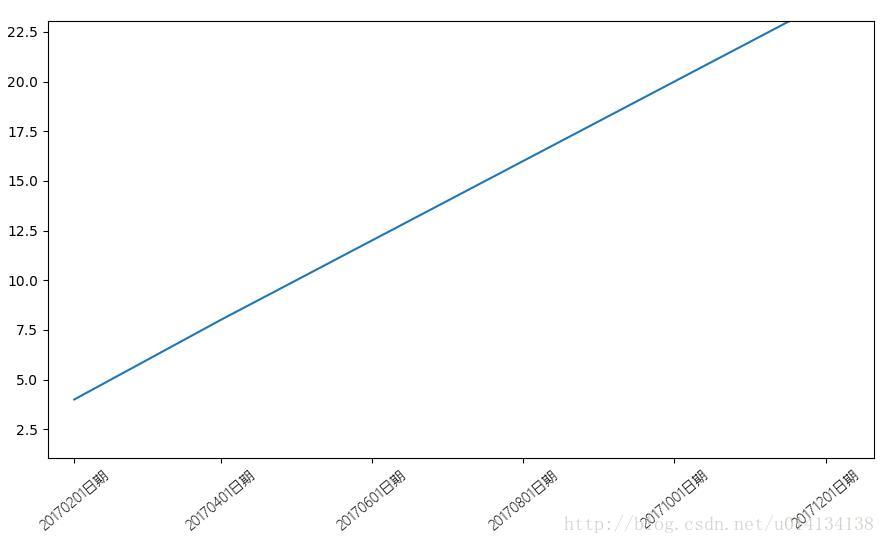
使用函数set_xticklabels
from matplotlib.font_manager import *
import matplotlib.pyplot as plt

import matplotlib.dates
import datetime

myfont = FontProperties(fname='/usr/share/fonts/chinese/msyhl.ttc')
matplotlib.rcParams['axes.unicode_minus']=False

fig = plt.figure()
ax = fig.add_subplot(111)

ax.xaxis.set_major_formatter(matplotlib.dates.DateFormatter('%Y%m%d'))
ax.xaxis.set_major_locator(matplotlib.dates.DayLocator(interval=1))

xs = ["2017%02d01" %t for t in range(1,13) if t%2==0]
xlabels = [t + '日期' for t in xs]
xs = [datetime.datetime.strptime(t, '%Y%m%d') for t in xs]
ys = [t*2 for t in range(1,13) if t%2==0]

ax.axes.set_xticks(xs)
ax.axes.set_xticklabels(xlabels,rotation=40,fontproperties=myfont)
#ax.axes.set_xlim(auto=True)

print(xs)

plt.plot(xs, ys)
#fig.autofmt_xdate()
#ax.text(0,0,u'-你好',fontproperties=myfont)

#ax.set_axis_off()

plt.show()

相关文章推荐
- 【Matplotlib】线设置,坐标显示范围
- 【Matplotlib】线设置,坐标显示范围
- 使用matplotlib的示例:调整字体-设置刻度、坐标、colormap和colorbar等
- python matplotlib 中文显示乱码设置
- matplotlib命令与格式:tick坐标轴主副刻度设置
- 学习python中matplotlib绘图设置坐标轴刻度、文本
- matplotlib坐标轴设置续-【老鱼学matplotlib】
- python matplotlib 中文显示参数设置
- matplotlib设置中文显示
- matplotlib中文显示坐标--修改matplotlibrc文件(for windows系统)
- python matplotlib 中文显示参数设置
- 【原】在Matplotlib绘图过程中设置X轴的刻度和显示文本
- 使用matplotlib绘制图像并设置标题以及坐标轴等信息
- matplotlib的基本用法(六)——设置坐标轴label
- matplotlib--设置坐标轴
- matplotlib 纵坐标轴显示数据值的实例
- python matplotlib 中文显示参数设置
- Python使用matplotlib模块绘制图像并设置标题与坐标轴等信息示例
- matplotlib时间坐标设置