初识R语言——PCA的实现
2017-10-22 15:42
281 查看
初识R语言 —— PCA的实现
回顾PCA
在之前的文章(老妪能解PCA)中曾经写过一些自己的PCA的看法,今天尝试用R语言来进行PCA的实现。回顾一下什么是PCA,总结来说就是基于对各个特征之间相关性的分析,从而找到主要成分并选取一定个数的特征向量作为新的基,从而得到样本在以新的基所构成的空间中的映射作为新的样本值,也就达到了降维的目的。数据描述
这次数据使用的是真实数据,数据的描述如下:Human body consists of about 70 trillion cells, where each of the cells have DNA molecules called genome (Figure 1). Here, the genome is only a storage unit for genetic information, which needs to be partially copied into a smaller unit called RNA for the actual utility (Figure 1). Each RNA molecule is much smaller than genome and only contains information of a single gene, while genome has genetic information of every genes. Here, the process partially copying genome into RNA is called transcription (Figure 1). After RNAs are transcribed from genome, they subsequently converted into polypeptides (or proteins), which are the actual machineries running cellular processes. This conversion is named as translation to distinguish from transcription (Figure 1).
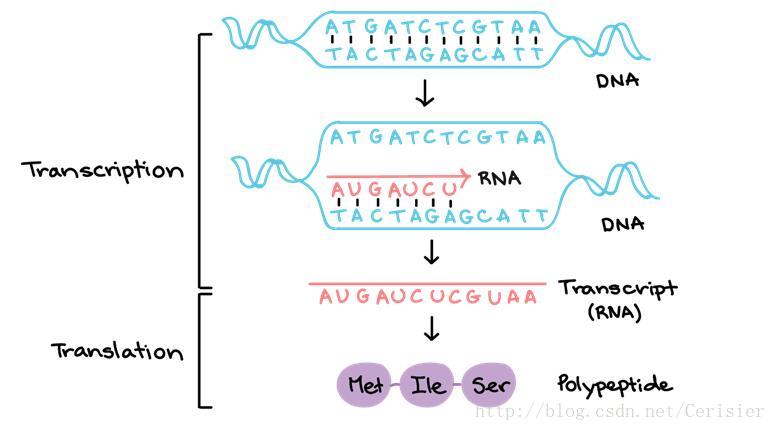
Figure 1. Description of transcription process
Cell needs to transcribe each gene only when it is needed, so each gene need to be selectively transcribed. And the control which gene is transcribed or not depends on the control unit called transcription factor, which is itself a protein. In general, multiple transcription factors are needed to transcribe a single gene, where the transcription factors are combined into a single protein-complex along with other mediator proteins. By bending DNA molecules into U-shaped structure, transcription factor complex make a physical force to move forward the copying machinery for transcription process (Figure 2). Therefore, the quantity of each gene’s transcript is controlled by the quantity of the corresponding transcription factors.

4000
Figure 2. Description of transcription factor’s action
As described, the biology of transcription process is well studied and the mechanism is quite straightforward. So, the only remaining problem is matching which factors control which genes. Extracting this information by using regression model is a famous problem in bioinformatics. We provide you a genome-wide profile of RNA quantity to make a regression model. The data we provide is RNA quantity data extracted from 20 different people. Each people have a single target gene (TG) as a dependent variable, and nine transcription factors (TF) as input variables.
简单来说就是描述了DNA转录的过程,生物的确是我高中时期的噩梦,高中毕业这么久为数不多的学到的知识,也已经还给老师了,真的是惭愧。。。根据描述,转录过程并不是对DNA全数的复制,而是有选择性的,这个过程是有一个可以学习的机制的。target gene(TG)是受9个 transcription factors(TF) 所控制的。而该样本是对20个人的采样。
R语言实现PCA
样本数据读入
> gene_table <- read.table("GeneExpr.Table.txt", sep="\t", head=T)
> gene_table
GeneExpr 就是我们的样本文件,”head = T” 的作用是是否将第一行设置成列名。如果“head = F”则表示我们将第一行也当做数据处理。

主要成分分析
其实R语言中有两个常用的函数,”princomp” 和 “prcomp”,来实现PCA。这是因为PCA的实现一般有两种,一种是用特征值(correlation和covariance)分解去实现的,一种是用奇异值(svd)分解去实现的。但实际上我们会发现两者的结果不会有太大的差别。当然这里有一点需要提醒,prcomp中有一个“scale”参数,是将一组数进行处理,默认情况下是将一组数的每个数都减去这组数的平均值后再除以这组数的均方根。而princomp中有一个“cor”参数,来决定是通过correlation还是covariance来计算。我们曾经在PCA那里讲过求特征值前样本 X 需要减去平均值,所以这里就要注意两个参数的对应问题。
> pca_princomp <- princomp(gene_table[,-10],cor=T)
> pca_prcomp <- prcomp(gene_table[,-10],scale=T)
这里princomp中cor取的是 TRUE, 说明采用的是 correlation, 所以相应的prcomp中也要进行scale操作。

这时候我们发现各主要成分是相似的,只是方向上有些差异。但是如果我们把两个函数中其中一个改变参数,那么结果就会有差异。比如我们将 princomp中的cor改为F,意味着现在要用covariance进行计算,就会得到不同的结果。

现假设都scale和cor的值都是F,我们使用语句:
> biplot(pca_prcomp, col = c("black", "white"))来观察前两维的结果。

得到降维后数据
我们已经得到了主要成分是不够的,我们还需要得到降维后的数据。> pca_data <- predict(pca_prcomp)
使用predict函数来得到PCA之后在各主要成分空间的数据。

对比上面的gene_table, 我们发现还是有变动的。
我们如果想降到2维,那么只用取前两列的数据,
> plot(pca_data[,1:2])
可以看到结果和之前的绘图相似。


相关文章推荐
- R语言中PCA方法实现
- VC++ 通过INI配置文件,实现多国语言切换界面
- Android的多语言实现
- Linux运维笔记-文档总结-Apache基本配置的介绍和语言支持,虚拟主机,访问控制的实现
- 面向IBM Tivoli Monitor 6.1 Universal Agent的Socket解决方案(Perl语言实现)
- A*算法解决八数码问题 Java语言实现
- Python语言实现哈夫曼编码
- 算法入门---java语言实现的二分搜索树小结
- 由前序遍历和中序遍历重建二叉树和C语言模式实现C++继承和多态——题集(十四)
- 用Verilog语言实现奇数倍分频电路3分频、5分频、7分频
- PASCAL语言子集的词法、语法分析器之实现
- Go语言的素数对象编程实现及其使用
- GPU实现“Blinn-Phong 光照模型”(Cg语言)
- XML的QL查询语言及其实现-1
- TCP/UDP client/server library for Java, 最好的java语言tcp udp 服务器客户端实现库
- SOA服务设计与实现的几个语言无关的原则速记
- 实现web多语言的一种解决办法
- C#的Windows编程中多语言的实现
- [汇编] 汇编语言实现简易文本编辑器(光标移动、上卷和退格删除)
- Flex开发的一些经验总结——本地化(多语言)实现