D3——绘制SVG图形-直方图
2017-09-15 16:27
302 查看
1、创建SVG元素
2、为SVG元素设置属性
或:
或:
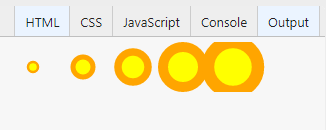
画圆实践
Bar Chart
根据div画chart
根据Rect画Chart
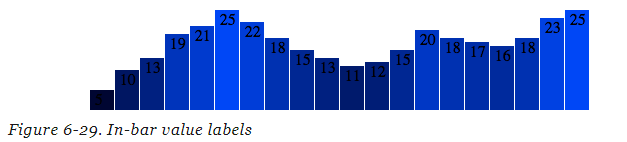
添加Lable:

改变Label显示位置
设置属性

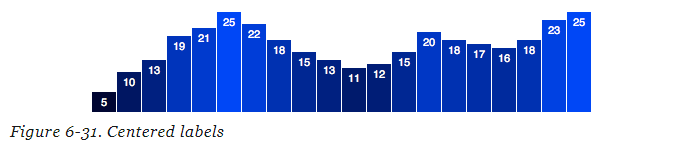
利用上面的方式计算label的位置,有时并不能很好的适应对应的bar,例如第一个label 5的位置,可以使用text-anchor属性居中
var svg = d3.select("body").append("svg");2、为SVG元素设置属性
svg.attr("width", 500)
.attr("height", 50);
或:
//Width and height
var w = 500;
var h = 50;
var svg = d3.select("body")
.append("svg")
.attr("width", w)   // <-- Here
.attr("height", h); // <-- and here!
或:
.attr({
width: w,
height: h
});
画圆实践
//Width and height
var w = 500;
var h = 50;

//Data
var dataset = [ 5, 10, 15, 20, 25 ];

//Create SVG element
var svg = d3.select("body")
.append("svg")
.attr("width", w)
.attr("height", h);

var circles = svg.selectAll("circle")
.data(dataset)
.enter()
.append("circle");

circles.attr("cx", function(d, i) {
return (i * 50) + 25;
})
.attr("cy", h/2)
.attr("r", function(d) {
return d;
})
.attr("fill", "yellow")
.attr("stroke", "orange")
.attr("stroke-width", function(d) {
return d/2;
});
Bar Chart
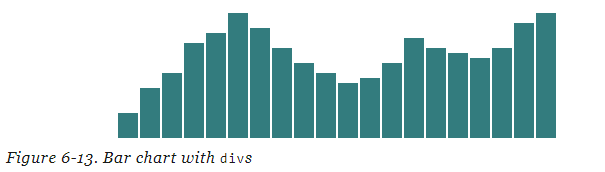
根据div画chart
var dataset = [ 5, 10, 13, 19, 21, 25, 22, 18, 15, 13,
11, 12, 15, 20, 18, 17, 16, 18, 23, 25 ];
d3.select("body").selectAll("div")
.data(dataset)
.enter()
.append("div")
.attr("class", "bar")
.style("height", function(d) {
var barHeight = d * 5;
return barHeight + "px";
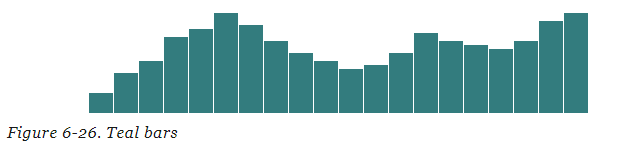
});根据Rect画Chart
//Width and height
var w = 500;
var h = 100;
var barPadding = 1; // <-- New!
var dataset = [ 5, 10, 13, 19, 21, 25, 22, 18, 15, 13,11, 12, 15, 20, 18, 17, 16, 18, 23, 25 ];
//Create SVG element
var svg = d3.select("body")
.append("svg")
.attr("width", w)
.attr("height", h);
svg.selectAll("rect")
.data(dataset)
.enter()
.append("rect")
.attr("x", function(d, i) {
return i * (w / dataset.length);
})
.attr("y", function(d) {
return h - (d*4); //Height minus data value
})
.attr("width", w / dataset.length - barPadding)
.attr("height", function(d) {
return d*4;
})
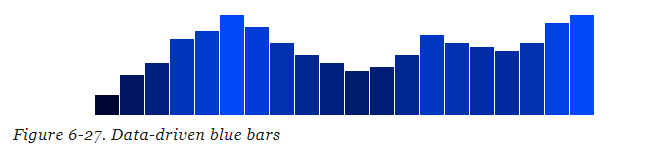
.attr("fill", "teal");.attr("fill", function(d) {
return "rgb(0, 0, " + (d * 10) + ")";
});添加Lable:
svg.selectAll("text")
.data(dataset)
.enter()
.append("text")
.text(function(d) {
return d;
})
.attr("x", function(d, i) {
return i * (w / dataset.length);
})
.attr("y", function(d) {
return h - (d * 4);
});
改变Label显示位置
.attr("x", function(d, i) {
return i * (w / dataset.length) + 5;  // +5
})
.attr("y", function(d) {
return h - (d * 4) + 15;              // +15
});
设置属性
.attr("font-family", "sans-serif")
.attr("font-size", "11px")
.attr("fill", "white");
利用上面的方式计算label的位置,有时并不能很好的适应对应的bar,例如第一个label 5的位置,可以使用text-anchor属性居中
.attr("x", function(d, i) {
return i * (w / dataset.length) + (w / dataset.length - barPadding) / 2;      //x位置为每个bar的中间
})
.attr("y", function(d) {
return h - (d * 4) + 14;  //15 is now 14
})
.attr("text-anchor", "middle")

相关文章推荐
- d3 svg 基本图形绘制
- SVG关注复杂图形的网页绘制技术
- HTML5之SVG 2D入门2―图形绘制(基本形状)介绍及使用
- 利用SVG path绘制图形--命令
- 【D3.js数据可视化系列教程】--(十五)SVG基本图形绘制
- 用d3引擎将数学函数绘制成图形
- 使用SVG绘制转盘图形加上转盘抽奖功能
- HTML5之SVG 2D入门2—图形绘制(基本形状)介绍及使用
- 【D3.V3.js系列教程】--(十五)SVG基本图形绘制
- 利用SVG path绘制图形--命令
- 基于SVG的web页面图形绘制API介绍及编程演示
- Swing图形绘制(长方形、椭圆、同心圆及直方图)
- SVG图形绘制入门第一弹
- [Web Chart系列之一]Web端图形绘制SVG,VML, HTML5 Canvas 技术比较
- [Web Chart系列之一(续)]Web端图形绘制SVG,VML, HTML5 Canvas 简单实例
- 使用 html5 svg 绘制图形
- SVG 2D入门2 - 图形绘制
- Python:使用pycha快速绘制办公常用图(饼图、垂直直方图、水平直方图、散点图等七种图形)
- svg绘制简单图形
- Python:使用pycha快速绘制办公常用图(饼图、垂直直方图、水平直方图、散点图等七种图形)