Nagios插件Nagiosgraph安装部署
2017-08-14 23:23
399 查看
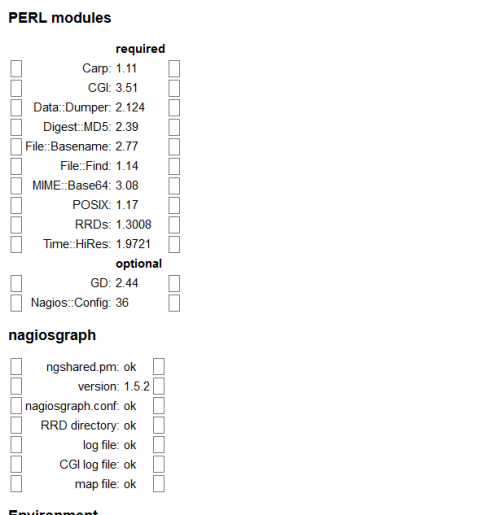
Nagios是比较常用的一款开源监控软件,Nagios灵活轻便使得在使用时可以根据自己的实际情况灵活运用,但是Nagios有一个缺点是对绘图做的不够完善,所以在对监控数据用来做分析时Nagios就有短板了。不过因为Nagios的灵活所以Nagios可以借助其他的方式实现图形报表的展示,今天在此就简要的说一说官方的Nagiosgraph插件,Nagiosgraph插件是用过Perl来实现的,所以在使用Nagiosgraph插件时就要确保系统中安装了Perl以及配置好相应的cpan源,这样才能进行安装,至于cpan的源配置以前有提及过,这里就不做说明,需要可以参看:http://jim123.blog.51cto.com/4763600/1895093 。Nagiosgraph插件的官方下载地址:https://sourceforge.net/projects/nagiosgraph/files/ ,建议下载最新稳定版,安装部署前需要先检查系统中是否有安装插件所需的依赖包:
确认没有问题后再到Nagios的share文件夹下修改Nagios的php页面文件side.php添加Nagiosgraph的链接制作伪静态页:
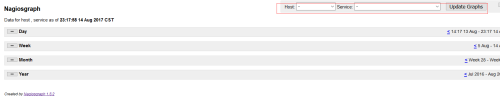
根据要选定的主机和服务生成图表,总之Nagiosgraph的配置是依赖于Perl配置起来还是比较简单的,但是生成的图表并不是非常的完美,不过也能满足日常的一些简单的分析,但是如果需要更好可以借助替他软件或插件实现,Nagios的图表展示。
[root@localhost nagiosgraph-1.5.2]# perl install.pl --check-prereq#像这样就是所有的插件都有安装了
checking required PERL modules
Carp...1.11
CGI...3.51
Data::Dumper...2.124
Digest::MD5...2.39
File::Basename...2.77
File::Find...1.14
MIME::Base64...3.08
POSIX...1.17
RRDs...1.3008
Time::HiRes...1.9721
checking optional PERL modules
GD...2.44
Nagios::Config...36
checking nagios installation
found nagios exectuable at /usr/local/nagios/bin/nagios
found nagios init script at /etc/init.d/nagios
checking web server installation
found apache executable at /usr/sbin/httpd
found apache init script at /etc/init.d/httpd
如果找到那一没有安装就安装下,建议在配置好yum源或者是apt源后进行安装如GD绘图安装:
[root@localhost nagiosgraph-1.5.2]# yum -y install perl-GD这里一般都会缺少安装Perl下的Nagios::Config模块,在配置好cpan源后使用cpan安装
[root@localhost nagiosgraph-1.5.2]# cpan Nagios::Config#注意有的时候还会缺少Digest::MD5模块等同理依次安装即可在解决所有的依赖关系后就可以开始安装配置,在安装时会有提示默认选项直接按回车就进行下一步
[root@localhost nagiosgraph-1.5.2]# perl install.pl在安装好后需要注意,最后会有提示需要在Nagios中做一些配置更改配置及操作方法,如:
# process nagios performance data using nagiosgraph
process_performance_data=1
service_perfdata_file=/tmp/perfdata.log
service_perfdata_file_template=$LASTSERVICECHECK$||$HOSTNAME$||$SERVICEDESC$||$SERVICEOUTPUT$||$SERVICEPERFDATA$
service_perfdata_file_mode=a
service_perfdata_file_processing_interval=30
service_perfdata_file_processing_command=process-service-perfdata-for-nagiosgraph
#修改Nagios的配置文件,在nagios.cfg添加

/bin/systemctl restart  httpd.service

* In the nagios commands file (command.cfg),
add these lines:

# command to process nagios performance data for nagiosgraph
define command {
command_name process-service-perfdata-for-nagiosgraph
command_line /usr/local/nagiosgraph/bin/insert.pl
}
#添加修改command.cfg配置文件

* In the apache configuration file (httpd.conf),
add this line:

Include /usr/local/nagiosgraph/etc/nagiosgraph-apache.conf
#在Nagios的用的httpd配置文件中添加nagiosgraph的包含
* Check the nagios configuration:

/usr/local/nagios/bin/nagios -v /path/to/nagios.cfg

* Restart nagios to start data collection:

/etc/init.d/nagios restart

* Restart apache to enable display of graphs:

/etc/init.d/httpd restart
#最后在多项检查重启后完成配置
* To enable graph links and mouseovers, see README sections:
Displaying Per-Service and Per-Host Graph Icons and Links
Displaying Graphs in Nagios Mouseovers同Nagios一样打开页面配置检查页面:http://IP/nagiosgraph/cgi-bin/showconfig.cgi确认没有问题后再到Nagios的share文件夹下修改Nagios的php页面文件side.php添加Nagiosgraph的链接制作伪静态页:
<?php $nagiosgraph_path = '/nagiosgraph/cgi-bin';?>
<li><a >Nagios图表</a></li>

<ul>

<li><a href="<?php echo $nagiosgraph_path;?>/show.cgi" target="<?php echo $link_target;?>">图表</a></li>
<li><a href="<?php echo $nagiosgraph_path;?>/showhost.cgi" target="<?php echo $link_target;?>">主机图表</a></li>
<li><a href="<?php echo $nagiosgraph_path;?>/showservice.cgi" target="<?php echo $link_target;?>">服务图表</a></li>
<li><a href="<?php echo $nagiosgraph_path;?>/showgroup.cgi" target="<?php echo $link_target;?>">主机组图表</a></li>

</ul>
</li>
最后在Nagios的页面下就有Nagiosgraph的图表链接
根据要选定的主机和服务生成图表,总之Nagiosgraph的配置是依赖于Perl配置起来还是比较简单的,但是生成的图表并不是非常的完美,不过也能满足日常的一些简单的分析,但是如果需要更好可以借助替他软件或插件实现,Nagios的图表展示。

相关文章推荐
- 被监控机上安装nagios插件和nrpe(nrpe添加为xinetd服务)
- 安装Elasticsearch5.0 部署Head插件
- idea2017+热部署插件jRebel安装与配置
- 【图解】Eclipse下JRebel6.2.0热部署插件安装、破解及配置【转】
- Nagios 安装 部署 说明
- eclipse的tomcat插件安装及其项目部署、调试
- Cacti+Nagios完全攻略(一)cacti与rrdtool安装部署
- Nagios的安装部署和与Cacti的整合
- Nagios中文插件安装
- eclipse安装tomcat插件、部署项目
- 一步一步学Nagios安装部署与监控
- 【图解】Eclipse下JRebel6.2.0热部署插件安装、破解及配置【转】
- 【图解】Eclipse下JRebel6.2.0热部署插件安装、破解及配置【转】
- intellij idea下面安装热部署插件 JRebel 5.2
- Centreon+Nagios监控系统安装与部署文档(一)
- Nagios安装PNP绘图插件
- IntelliJ安装JRebel热部署插件
- Ubuntu下nagios安装pnp4nagios插件
- nagios分支Icinga安装部署配置