Unity自定义UI组件(十) 折线图
2017-08-01 16:14
225 查看
前言
在工程三维可视化领域,用图表展示数据较为常用,近期看有人在论坛里所求折线图插件,于是我就把折线图(LineChartGraph)也加入了SpringGUI中,这里我简单介绍一下,便于有需要的人使用。
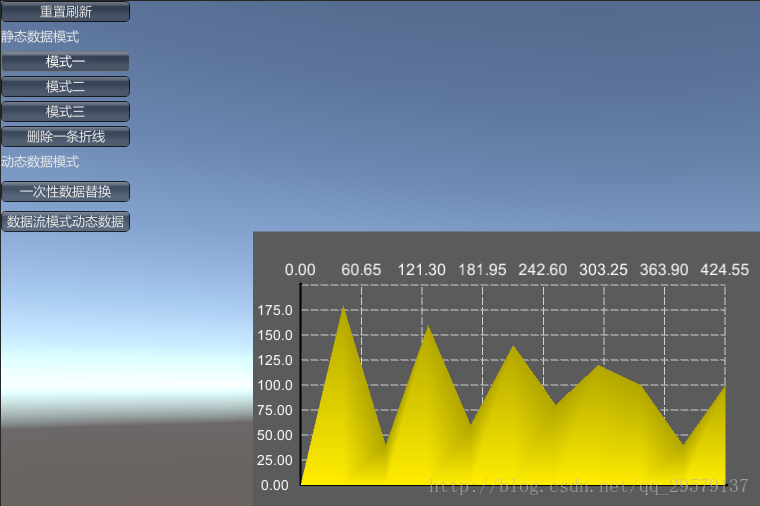
组件效果
动态效果
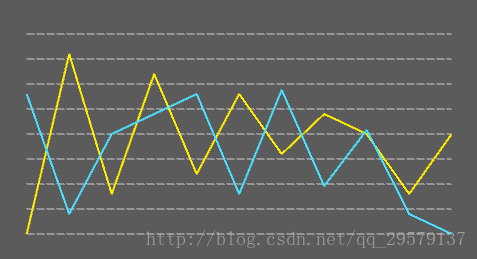
模式一
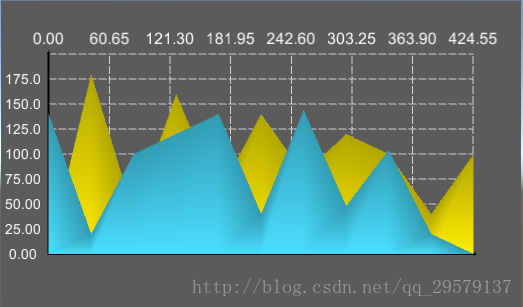
- 模式二
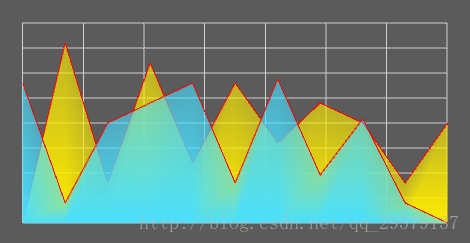
- 模式三
案例
组件特点
无需Asset资源无需制作Prefab
支持动态流式数据
工厂模式搭建,便于新的样式的接入
主要内容
组件实现多样式控制
组件的使用
详细讲解
组件实现
经过之前多篇组件开发的讲解了,以后我就不再讲解具体的代码,以下几点如果你有不懂,可以去看自定义组件的前两篇都有讲解。坐标轴
略..看源码或者见Unity自定义UI组件(二)函数图篇(下)
网格
略..看源码或者见Unity自定义UI组件(二)函数图篇(下)
折线
略..看源码或者见Unity自定义UI组件(二)函数图篇(下)
动态数据输入
支持自定义动态数据的输入,我们需要利用一个数据解析器来充当中介者,数据源无需直接输入折线图组件,这样不利于组件的封装。客户端持有一个中介者,通过中介者,在中介者中重写数据解析模块,再将数据流输入折线图组件绘制。
案例类型
public class TestData
{
public float xValue { get; set; }
public float yValue { get; set; }
}12
3
4
5
1
2
3
4
5
中介者
如果T泛型传的类型是你自己的类型,要重写Inject方法保证返回的Vector2位Vector2.zero到Vector2.one之间
因为组件的左下角是(0,0)点,右上角是(1,1)点
public IList<Vector2> Inject<T>( IList<T> vertexs )
{
IList<Vector2> result = new List<Vector2>();
Type type = typeof(T);
PropertyInfo[] PropertyInfo = type.GetProperties();
// 反射遍历属性获取顶点值
foreach ( T vertex in vertexs )
{
float x = 0.0f;
float y = 0.0f;
foreach ( PropertyInfo info in PropertyInfo )
{
if ( info.Name.Equals("xValue") )
x = (float)info.GetValue(vertex , null);
if ( info.Name.Equals("yValue") )
y = (float)info.GetValue(vertex , null);
}
result.Add(new Vector2(x , y));
}
return result;
}12
3
4
5
6
7
8
9
10
11
12
13
14
15
16
17
18
19
20
21
1
2
3
4
5
6
7
8
9
10
11
12
13
14
15
16
17
18
19
20
21
替换新的静态数据
全盘替换新的数据,只需要在中介者中通过解析之后,将折线图中的数据覆盖并重新调用绘制方法绘制。我们提供重载函数,方便一条或者多条折线的操作。
public void Replace<T>( int id , IList<T> vertexs )
{
Replace(new int[] { id } , new IList<T>[] { vertexs });
}

public void Replace<T>( int[] ids , IList<T>[] vertexs )
{
// 在dateMediator中进行解析之后,数据传送给lineChartData数据中
LineChartBasis.ReplaceLines(ids , m_dataMediator.Inject(vertexs));
// 重新绘制折线
OnEnable();
}12
3
4
5
6
7
8
9
10
11
12
1
2
3
4
5
6
7
8
9
10
11
12
实时动态数据
实时动态数据,每次只传入一个顶点的数据,因此我们需要制作出一个比较不违和的动画,就需要处理帧动画,比如每传入一个点,触发一个二十帧的动画,通过绘制二十次折线,以达到动画的效果。这里的帧动画我们依靠代码来完成。
在折线图向左移动时,第一个顶点和最后一个顶点要实时获取Y值,以保证效果,中间的顶点我们只需要每帧减少固定的距离即可,
// 注入流式数据的接口
public void InjectVertexStream<T>( int id , IList<T> vertexs )
{
IList<Vector2> vertex = m_dataMediator.Inject(vertexs);
StartCoroutine(StreamInject(id , vertex));
}

// 处理流式数据
private IEnumerator StreamInject( int id , IList<Vector2> vertexs )
{
for (int m = 0; m < vertexs .Count; m++)
{
IList<Vector2> oldVertexs = LineChartBasis.GetLine(id);
var last = oldVertexs[oldVertexs.Count - 1];
oldVertexs.Add(new Vector2(last.x + 0.1f , vertexs[m].y));
// 获取第一个顶点和最后一个顶点的高度位置差
// 用于帧动画中计算顶点的y值
var startOffset = oldVertexs[1].y - oldVertexs[0].y;
var endOffset = oldVertexs[oldVertexs.Count - 1].y - oldVertexs[oldVertexs.Count - 2].y;
for ( int i = 1 ; i <= 10 ; i++ )
{
IList<Vector2> newVertexs = new List<Vector2>();
// 刷新第一个顶点
newVertexs.Add(new Vector2(0 , oldVertexs[0].y + i * 0.1f * startOffset));
// 将中间的顶点向左移动固定距离
for ( int j = 0 ; j < oldVertexs.Count - 2 ; j++ )
newVertexs.Add(oldVertexs[j + 1] - new Vector2(0.01f * i , 0));
// 刷新最后一个顶点
newVertexs.Add(new Vector2(1, oldVertexs[oldVertexs.Count - 2].y + 0.1f * i * endOffset));
// 赋值
LineChartBasis.ReplaceLines(new int[] { id } , new IList<Vector2>[] { newVertexs });
// 重新绘制
OnEnable();
// 在每个顶点执行到最后一帧,移除第一个顶点,以保证后续点加入的正常
if ( i.Equals(10) )
{
newVertexs.RemoveAt(0);
LineChartBasis.ReplaceLines(new int[] { id } , new IList<Vector2>[] { newVertexs });
}
// 协程中暂停0.05秒,以形成帧动画
yield return new WaitForSeconds(0.05f);
}
}
}12
3
4
5
6
7
8
9
10
11
12
13
14
15
16
17
18
19
20
21
22
23
24
25
26
27
28
29
30
31
32
33
34
35
36
37
38
39
40
41
42
43
44
1
2
3
4
5
6
7
8
9
10
11
12
13
14
15
16
17
18
19
20
21
22
23
24
25
26
27
28
29
30
31
32
33
34
35
36
37
38
39
40
41
42
43
44
接口开发
随着SpringGUI组件一直迭代增加新的组件,我们应该逐渐意识到开发自己的组件方便别人使用的时候,有些时候需要强制输入固定合适的数据,如果没有这样做,那么这个组件就不符合设计模式中的开放封闭原则,如果我们没有固定的数据格式,那么别人在使用组件的时候就得根据自己的开发需求去设计数据的输入,比如本篇的折线图,绘制折线图需要一串顶点流数据,但是实际的数据可能是(x,y)(日期,数量)(月份,增长率)等等,因此我们需要强制输入固定的数据以封装了变化,关闭修改,开放拓展。只需要用户自行通过数据中介将数据拓展转化为固定数据(在LineChartGraph组件中我们将数据格式规定为左下角(0,0),右上角(1,1)),这样使用组件时避免了更改组件的代码,而只需要通过数据中介转化格式并传递给组件。
API
Inject 注入普通数据
RemoveLine 移除某一条折线
Replace 替换某一条折线的顶点
InjectVertexStream 传入流式顶点数据
ShowUnit 显示单位
多样式控制
接口开发中我们遵循开放封闭原则,在多样式控制中为了便于拓展和修改,我们应该采用工厂模式,每一种样式只是绘制折线网格时算法不一样、或者是绘制背景网格不一致再或是绘制坐标轴不一致,但是步骤都是一致的,我们可利用抽象工厂(我们用接口代替),工厂中可以绘制坐标轴,网格,折线,客户端只需要持有工厂接口,然后根据实际需要调用对应的工厂来绘制,工厂模式也是遵循开放封闭原则的一种设计模式。public interface ILineChart
{
VertexHelper DrawLineChart( VertexHelper vh , Rect rect , LineChartData basis);
VertexHelper DrawMesh( VertexHelper vh );
VertexHelper DrawAxis( VertexHelper vh );
}
public class BaseLineChart : ILineChart
{
// 实现接口,写入基本的算法
// 需要特殊定制的在子类中重写
}
public class LineChart1 : BaseLineChart
{
public override VertexHelper DrawLineChart(VertexHelper vh, Rect vRect, LineChartData VBasis)
{
//..重写该方法绘制独特的样式
}
}12
3
4
5
6
7
8
9
10
11
12
13
14
15
16
17
18
19
20
1
2
3
4
5
6
7
8
9
10
11
12
13
14
15
16
17
18
19
20
然后再客户端我们只需要持有ILineChart即可,然后根据当前所选的类型由对应工厂绘制
private ILineChart LineChartCreator
{
get
{
// 根据类型实例化对应的工厂绘制
switch ( lineChartType )
{
case LineChartType.LineChart1:
return new LineChart1();
case LineChartType.LineChart2:
return new LineChart2();
case LineChartType.LineChart3:
return new LineChart3();
default:
return new LineChart1();
}
}
}

protected override void OnPopulateMesh(VertexHelper vh)
{
vh.Clear();
if ( LineChartBasis.Lines.Count.Equals(0) )
return;
var rect = base.GetPixelAdjustedRect();
// 调用工厂绘制
LineChartCreator.DrawLineChart(vh, rect,LineChartBasis);
}12
3
4
5
6
7
8
9
10
11
12
13
14
15
16
17
18
19
20
21
22
23
24
25
26
27
28
1
2
3
4
5
6
7
8
9
10
11
12
13
14
15
16
17
18
19
20
21
22
23
24
25
26
27
28
组件的使用
这里我们展示一下基础的使方法,以上提到的API在代码的Example例子中具体的查看public class LineChartGraphExample : MonoBehaviour
{
// 自定义数据类型,会用于反射获取值
public class TestData
{
public float xValue { get; set; }
public float yValue { get; set; }
public TestData( float x ,float y )
{
xValue = x;
yValue = y;
}
}
public LineChart LineChart = null;
public void Awake()
{
// 生成模拟值
// 每隔值x坐标一定是相隔固定距离
// 否则在传入动态数据流式会出现动画的偏差
var data1 = new List<TestData>()
{
new TestData(0.0f,0.0f),
new TestData(0.1f,0.9f),
new TestData(0.2f,0.2f),
new TestData(0.3f,0.8f),
new TestData(0.4f,0.3f),
new TestData(0.5f,0.7f),
new TestData(0.6f,0.4f),
new TestData(0.7f,0.6f),
new TestData(0.8f,0.5f),
new TestData(0.9f,0.2f),
new TestData(1f,0.5f),
};
var data2 = new List<TestData>()
{
new TestData(0.0f,0.7f),
new TestData(0.1f,0.1f),
new TestData(0.2f,0.5f),
new TestData(0.3f,0.6f),
new TestData(0.4f,0.7f),
new TestData(0.5f,0.2f),
new TestData(0.6f,0.72f),
new TestData(0.7f,0.24f),
new TestData(0.8f,0.52f),
new TestData(0.9f,0.1f),
new TestData(1f,0.0f),
};
// 插入值
LineChart.Inject<TestData>(data1);
LineChart.Inject<TestData>(data2);
// 显示单位
LineChart.ShowUnit();
}
}12
3
4
5
6
7
8
9
10
11
12
13
14
15
16
17
18
19
20
21
22
23
24
25
26
27
28
29
30
31
32
33
34
35
36
37
38
39
40
41
42
43
44
45
46
47
48
49
50
51
52
53
54
55
56
57
58
1
2
3
4
5
6
7
8
9
10
11
12
13
14
15
16
17
18
19
20
21
22
23
24
25
26
27
28
29
30
31
32
33
34
35
36
37
38
39
40
41
42
43
44
45
46
47
48
49
50
51
52
53
54
55
56
57
58
后续拓展
后续打算开发一个表格组件,实现简单的excel的功能。如果你有什么需要的组件,不妨在评论区留言,我来实现。

相关文章推荐
- Unity自定义UI组件(十) 折线图
- Unity自定义UI组件(九) 颜色拾取器(下)
- Unity自定义UI组件(二)函数图篇(下)
- Unity自定义UI组件(九) 颜色拾取器(下)
- Unity自定义UI组件(四)双击按钮、长按按钮
- Unity自定义UI组件(十二) 条形图篇
- Unity自定义UI组件(八) 颜色拾取器(上)
- Unity自定义UI组件(十一) 雷达图、属性图
- Unity自定义UI组件(七)渐变工具、渐变色图片、渐变遮罩
- Unity自定义UI组件(三)饼图篇
- Unity自定义UI组件(一)函数图篇(上)
- Unity自定义UI组件(七)渐变工具、渐变色图片、渐变遮罩
- Unity自定义UI组件(一)函数图篇(上)
- Unity自定义UI组件(二)函数图篇(下)
- [资源分享][Unity][UGUI][DIY]自定义统计UI组件分享
- Unity自定义UI组件(三)饼图篇
- Unity自定义UI组件(四)双击按钮、长按按钮
- Unity自定义UI组件(六)日历、日期拾取器
- Unity自定义UI组件(七)渐变工具、渐变色图片、渐变遮罩
- Unity自定义UI组件(六)日历、日期拾取器