Football数据集可视化处理——gephi可视化处理数据
2017-07-31 11:31
1196 查看
1 football数据集的文件格式
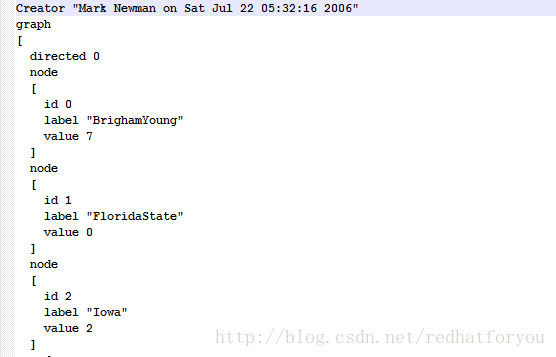
根据如图所示football数据集和的文件格式如下所示:下图表示football数据集节点部分信息
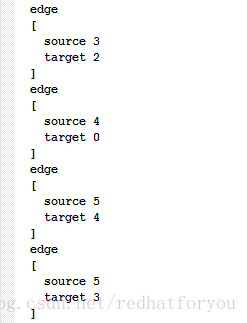
下图表示football数据集边的部分信息
根据上述两个图中的格式对football数据集的格式介绍可以介绍为如下所示:
Creator "Mark Newman on Sat Jul 22 05:32:16 2006"
graph
[
node
[
id **
value **
label ****
]
...
node
[
id **
value **
label ****
]
edge
[
id **
value **
label ****
]
...
edge
[
id ***
value **
label ****
]
]
2 football数据集文件格式的转化
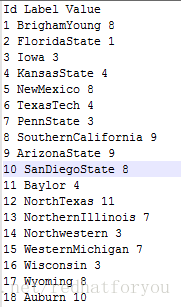
根据上述的football文件,我们将数据文件转化成两个文件,这两个文件分别用来存储football数据集的边信息和节点信息,对football数据集文件的处理如下。2.1 football数据集节点信息文件
根据gephi通过csv导入信息的需要,我们将数据信息处理成如下的数据集节点文件格式:Id Label Value 1 Tom 3 2 Bob 4
在football数据集中将football.gml文件处理得到的结果如下所示:
其中:
Id:用于标识唯一的一个点
Label:标识节点的标签或者是名称
Value:标识节点的所属的社区。
2.2 football数据集边信息文件
根据gephi通过csv导入数据的格式,我们分为有向图和无向图两种数据格式,对于有向图的导入数据格式如下所示:Source Target Weight 1 3 2 2 4 1
根据上述公式:
Source:表示源节点
Target:表示目的结点
Weight:表示对应的边的权重
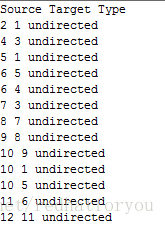
在无向图的导入中需要加入Type类型得出的数据格式如下所示:
Source Target Weigth Type
1 3 2 Undirected
2 4 1 Undirected
如下图所示为football数据集的数据个格式,football数据集是无权图因此没有有weight。
在football数据集的616条边中有三条边是重复出现的分别为
28 18
85 4
100 15
在通过gephi对这些边进行模块化社区划分运算的时候需要将这些边删除,否则无法运行。
2.3 对football.gml处理代码
#include <iostream>
#include <stdio.h>
#include <string.h>
#include <stdlib.h>
using namespace std;

int main()
{
FILE* inputfile = NULL;
FILE* nodefile = NULL;
FILE* edgefile = NULL;
inputfile = fopen("football.gml","r");
nodefile = fopen("nodefile.txt","w");
edgefile = fopen("edgefile.txt","w");
fprintf(nodefile, "Id Label Value\n");
fprintf(edgefile,"Source Target Type\n");
char strLine[1024];
int i = 0;
int node = 0;
int edge = 0;
//char nodeinfo[100];
char edgeinfo[100];
while(!feof(inputfile))
{
fgets(strLine,1024, inputfile);
if(strncmp(strLine+4,"id",2)==0 )
{
char id[5];
char label[50];
char value[5];
memset(label,0,50);
int idint = 0, valueint = 0;
int copylen = 0;
copylen = strlen(strLine) - 8;
strncpy(id,strLine+7,copylen);
idint = atoi(id)+1;
fgets(strLine,1024, inputfile);
copylen = strlen(strLine) - 13;
strncpy(label,strLine+11,copylen);
fgets(strLine,1024, inputfile);
copylen = strlen(strLine) - 10;
strncpy(value,strLine+10,copylen);
valueint = atoi(value)+1;
//cout << valueint << endl;
fprintf(nodefile,"%d %s %d\n",idint,label,valueint);
}
if(strncmp(strLine+4,"source",6)==0)
{
char target[5];
char source[5];
int sourceint = 0,targetint = 0;
memset(target,0,5);
memset(source,0,5);
int copylen = 0;
copylen = strlen(strLine)-12;
strncpy(source,strLine+11,copylen);
sourceint = atoi(source)+1;
fg
b28f
ets(strLine,1024, inputfile);
copylen = strlen(strLine)-12;
strncpy(target,strLine+11,copylen);
targetint = atoi(target)+1;
fprintf(edgefile,"%d %d undirected\n",sourceint,targetint);
}
}
fclose(nodefile);
fclose(edgefile);
return 0;
}
3 gephi点表和边表的导入并生成football图像
(1)点击文件->Import spreadsheet如下图所示: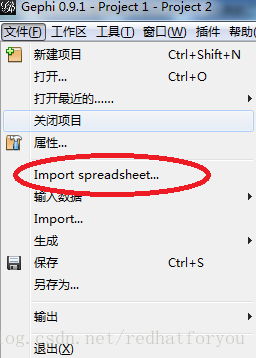
(2)选择需要导入的文件进行数据导入
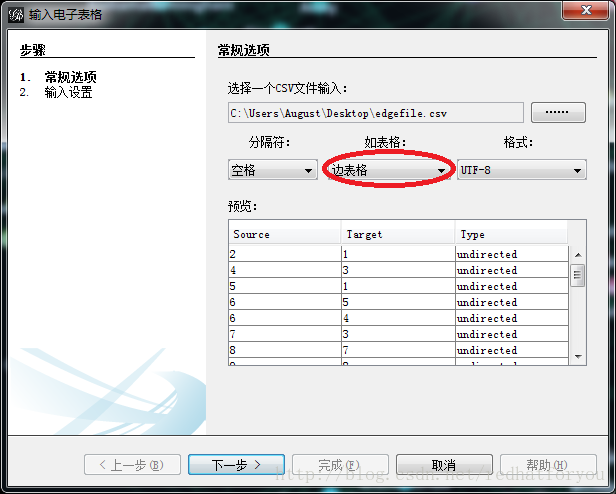
注意选择导入的是边表格还是点表格
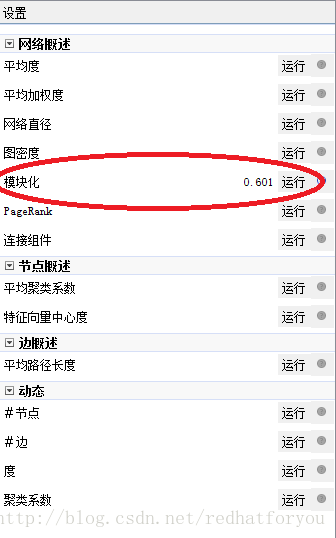
(3)点击模块化
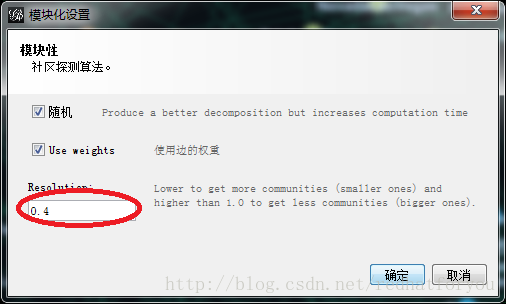
(4)设置参数为0.4
(5)选择节点的渲染方式为Modularity Class
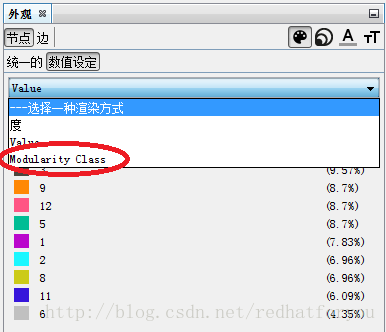
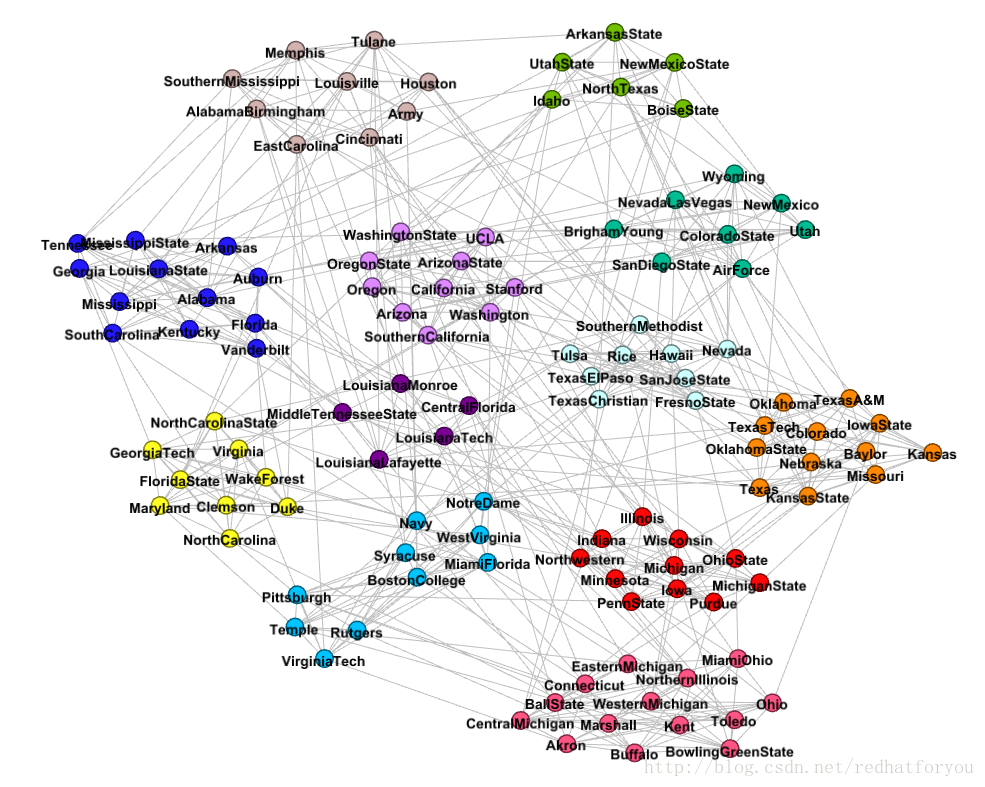
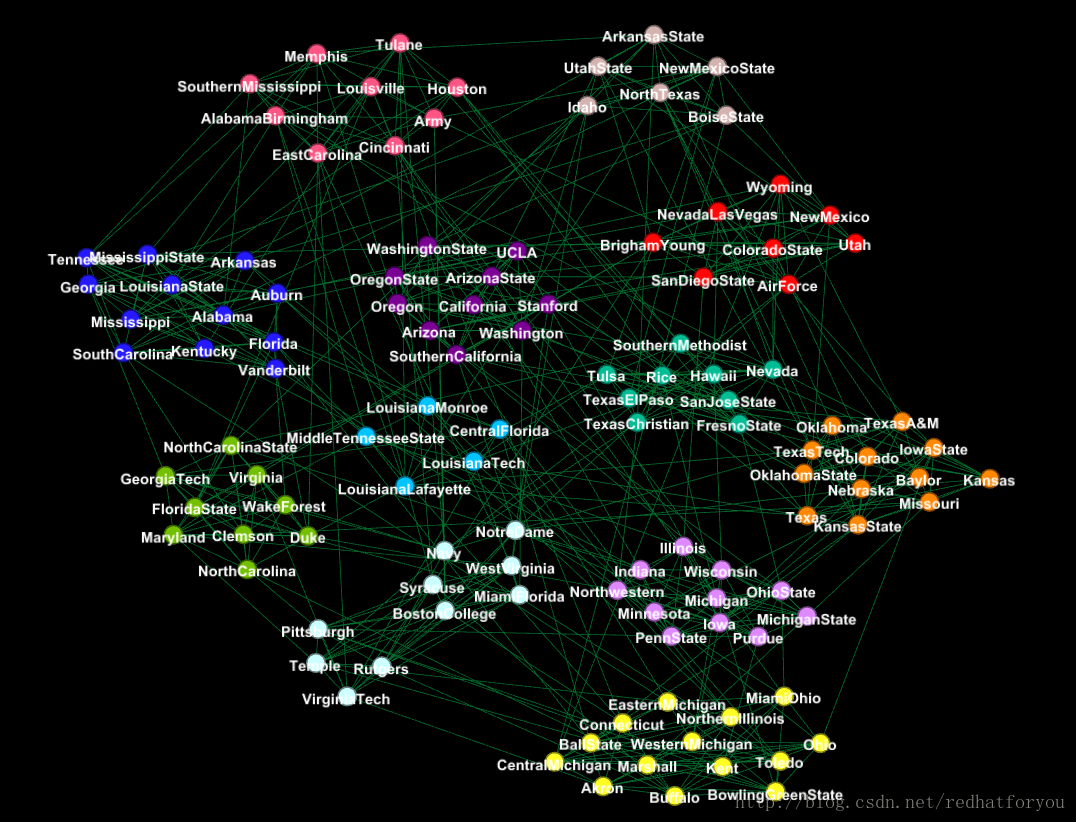
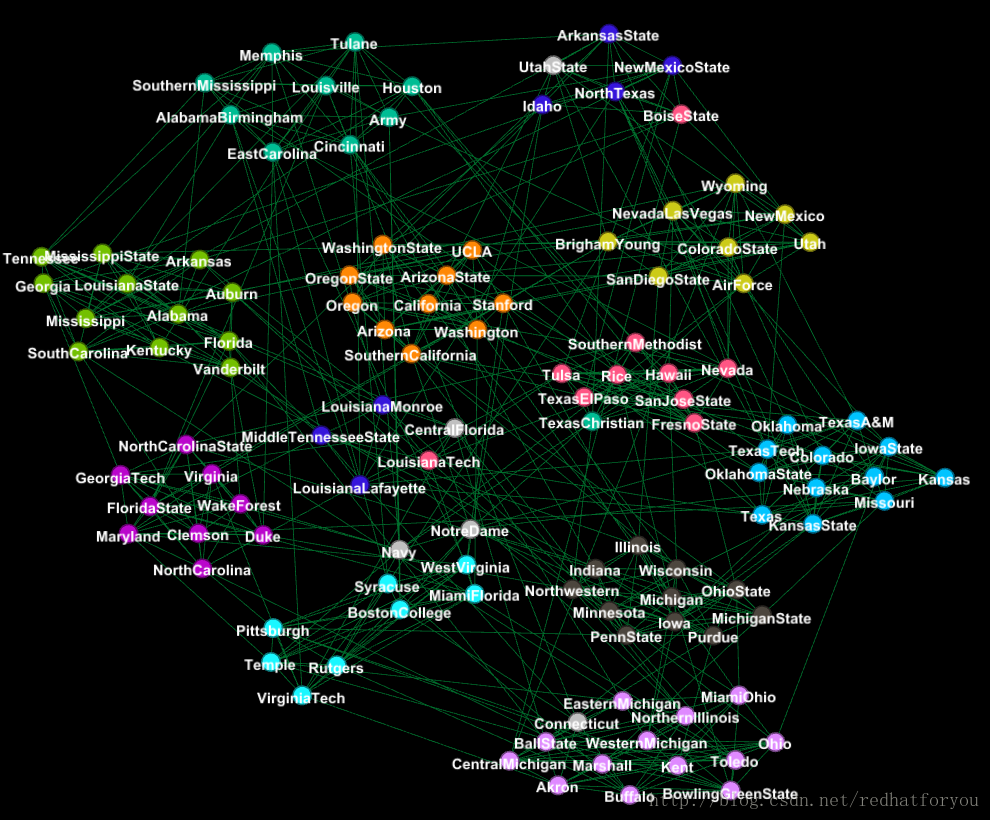
(6)得到football的社区划分和真实社区对比
football数据集通过gephi进行社区划分的结果(不带有边的图)
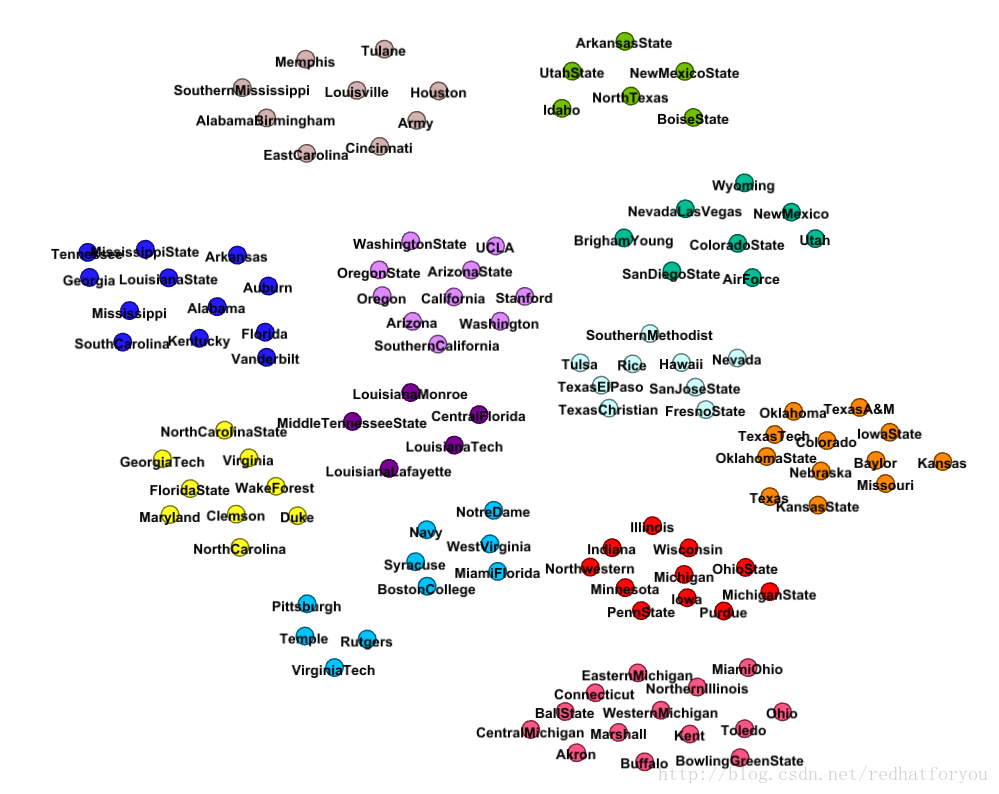
football数据集真实社区的结果(不带有边的图)

football数据集通过gephi进行社区划分的结果(带有边的图)
football数据集真实社区的结果(带有边的图)
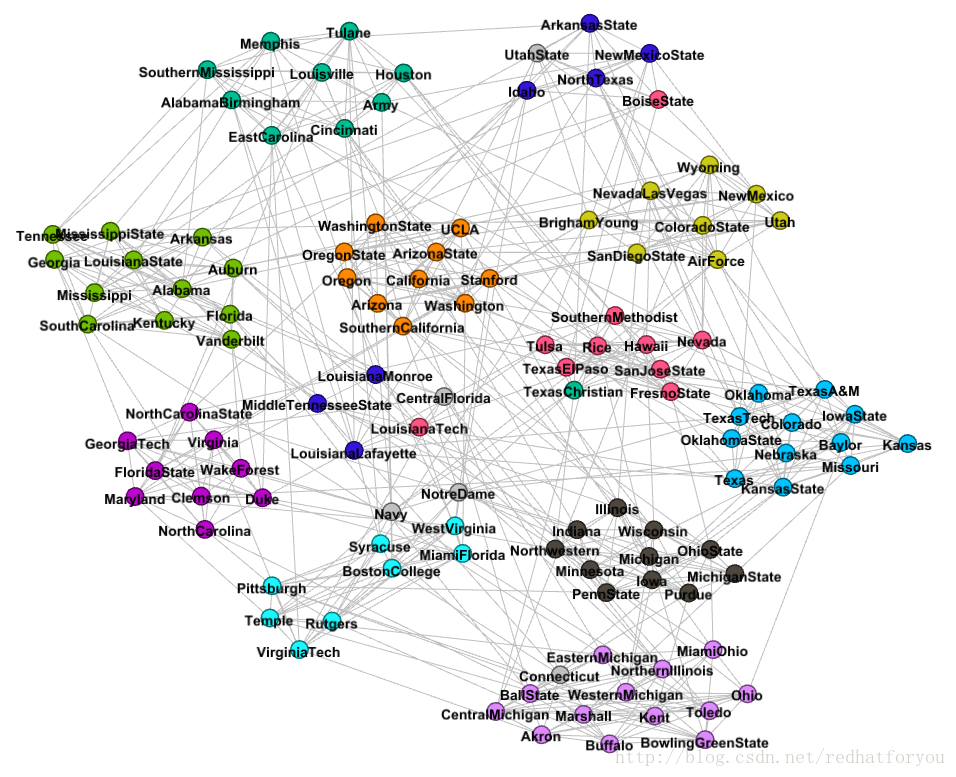
根据上述的结果我们可以对比得到gephi生成的社区和真实社区的差别,并且最终得到如下所示的两张对比图片。
gephi基于模块度生成社区划分的图片
football给出的标签的真实社区图片

相关文章推荐
- .net多语言和数据集内多数据表的处理(3)
- 大数据处理开放数据集
- 基于GephiSDK的数据可视化功能开发
- 地铁译:Spark for python developers ---Spark处理后的数据可视化
- .net多语言和数据集内多数据表的处理(1)
- java数据可视化--圆柱体乱码处理
- .net多语言和数据集内多数据表的处理(2)
- .net多语言和数据集内多数据表的处理(2)
- 【python数据挖掘课程】十九.鸢尾花数据集可视化、线性回归、决策树花样分析
- (转)R空间数据处理与可视化
- Python下的数据处理和机器学习,对数据在线及本地获取、解析、预处理和训练、预测、交叉验证、可视化
- 基因数据处理32之Avocado运行记录(人造数据集)
- 数据集处理成可视树,数据网格自动适应宽度
- 强类型的数据集,在处理以直接附加方式的SQLServer的MDF文件时无法更新数据-原因分析
- Hive数据分析——Spark是一种基于rdd(弹性数据集)的内存分布式并行处理框架,比于Hadoop将大量的中间结果写入HDFS,Spark避免了中间结果的持久化
- Gephi大数据可视化
- PLUTO平台是由美林数据技术股份有限公司下属西安交大美林数据挖掘研究中心自主研发的一款基于云计算技术架构的数据挖掘产品,产品设计严格遵循国际数据挖掘标准CRISP-DM(跨行业数据挖掘过程标准),具备完备的数据准备、模型构建、模型评估、模型管理、海量数据处理和高纬数据可视化分析能力。
- PLUTO平台是由美林数据技术股份有限公司下属西安交大美林数据挖掘研究中心自主研发的一款基于云计算技术架构的数据挖掘产品,产品设计严格遵循国际数据挖掘标准CRISP-DM(跨行业数据挖掘过程标准),具备完备的数据准备、模型构建、模型评估、模型管理、海量数据处理和高纬数据可视化分析能力。
- 【Tensorflow】怎样为你的网络预加工和打包训练数据?(二):小数据集的处理方案
- 在listUI填充数据前对数据集进行处理