实时日志分析平台搭建笔记(二)
2017-07-04 00:00
302 查看
接上一篇。ES采用两台服务器的集群,创建一个indices,名称为access-log,jstorm和spark处理后的日志写入其中。


注意:创建完access-log后,在写入数据前,需要运行以下命令,"time"为时间字段,"vulType"为_type
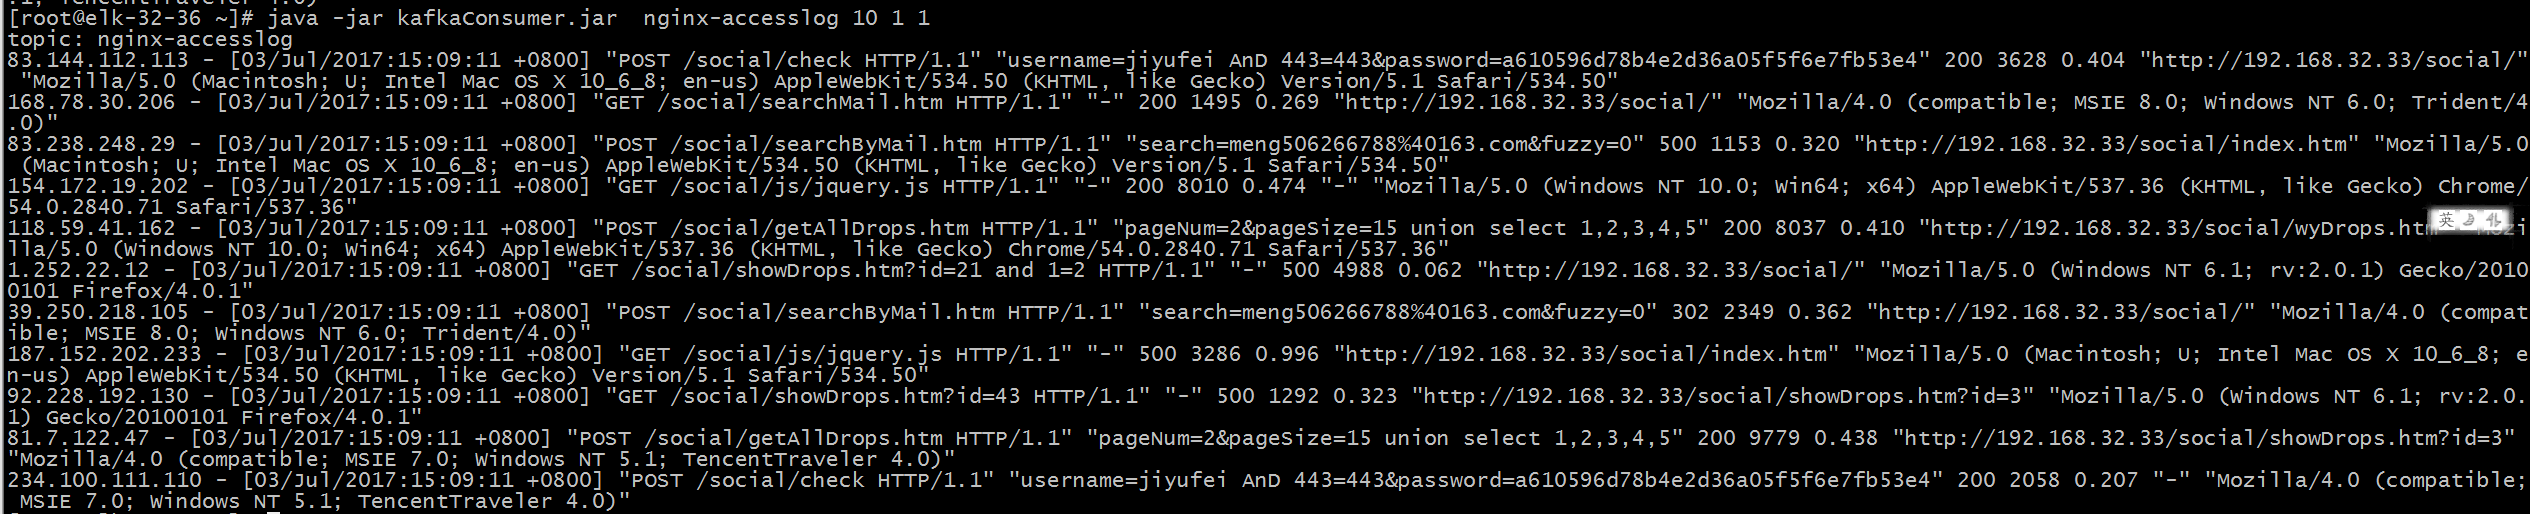
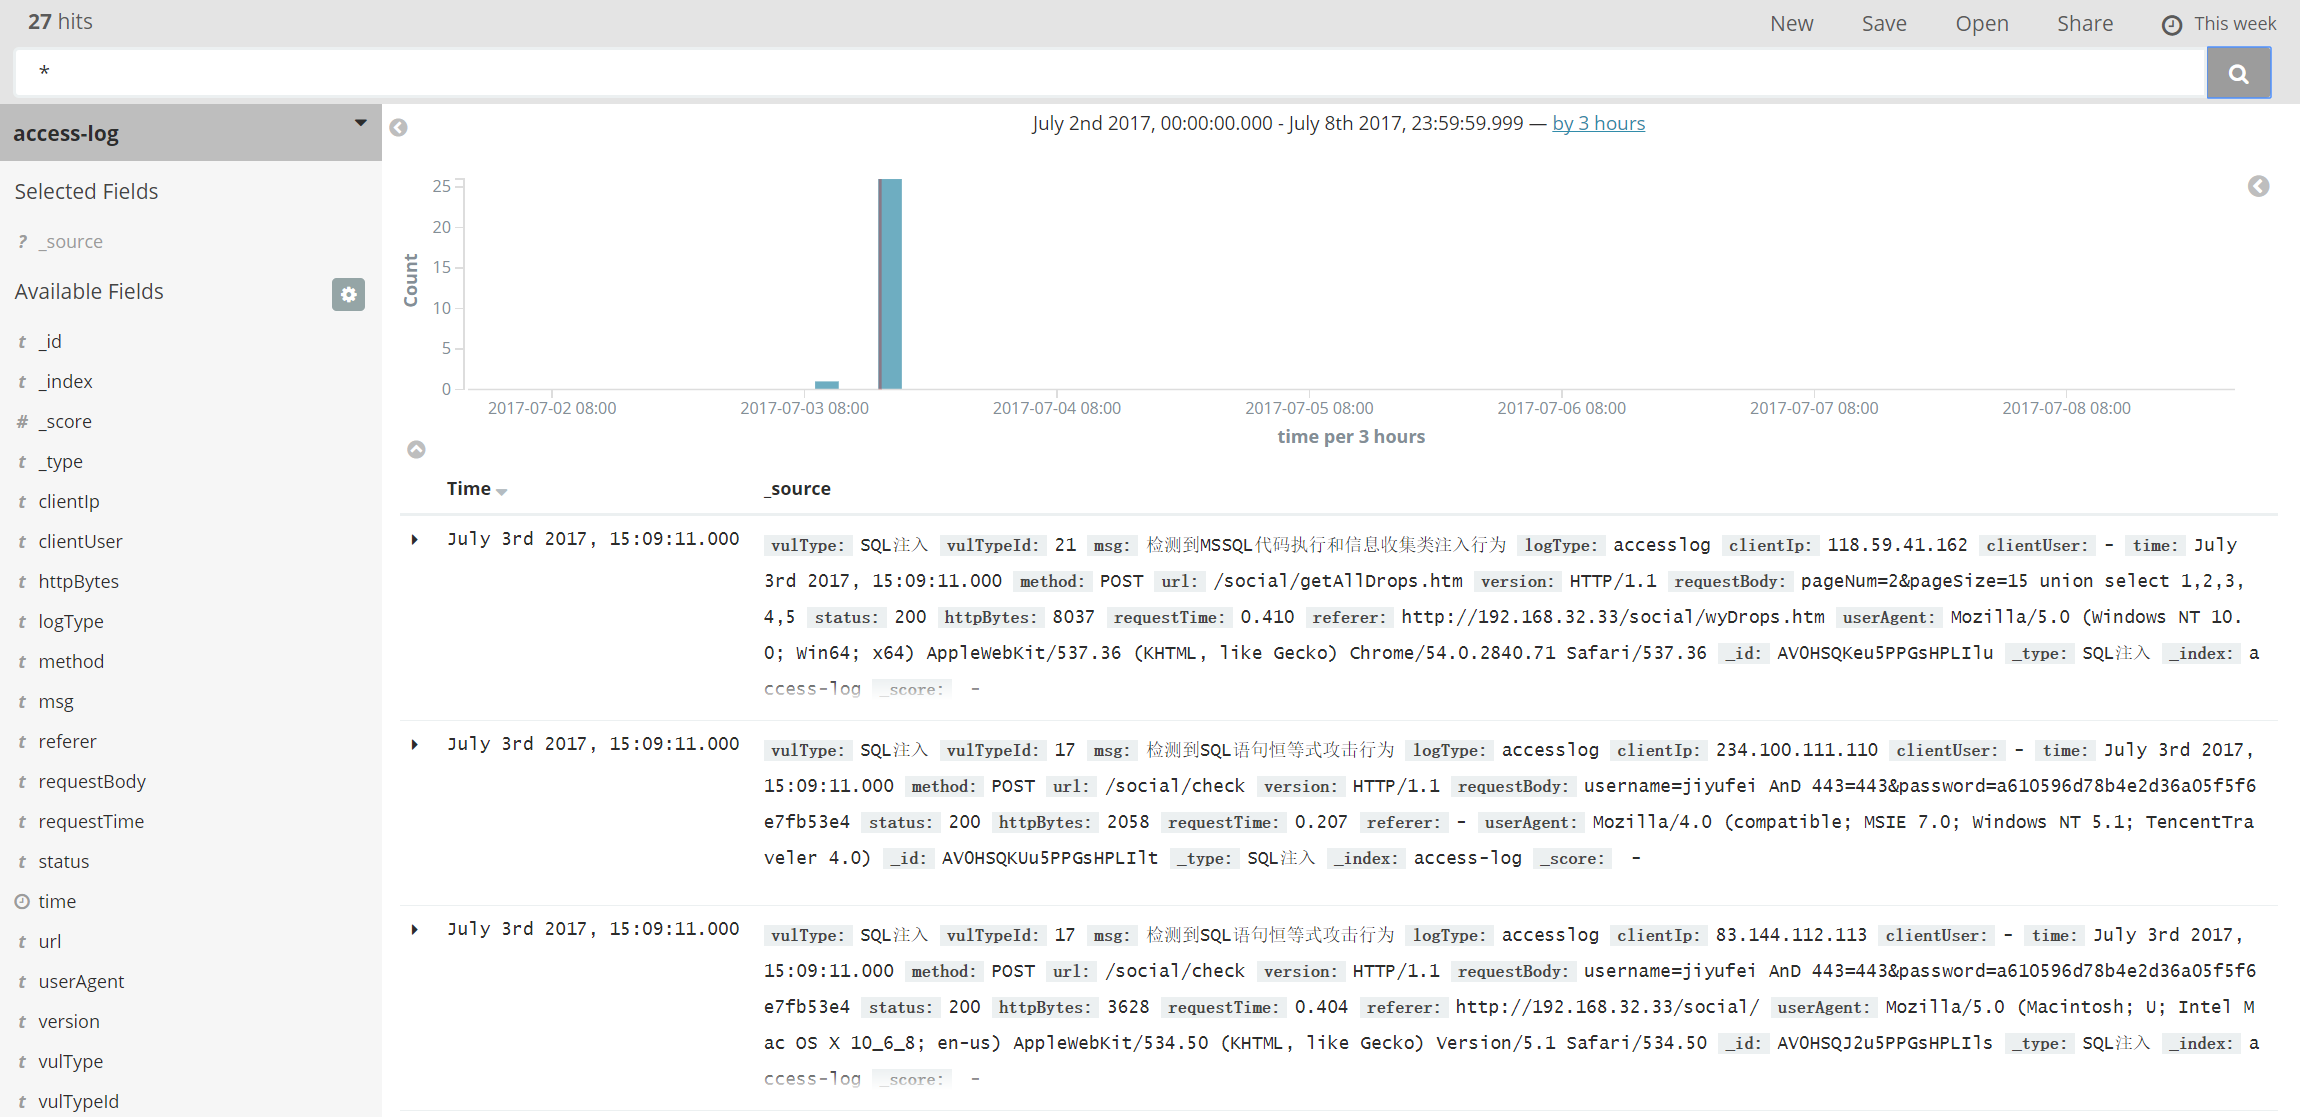
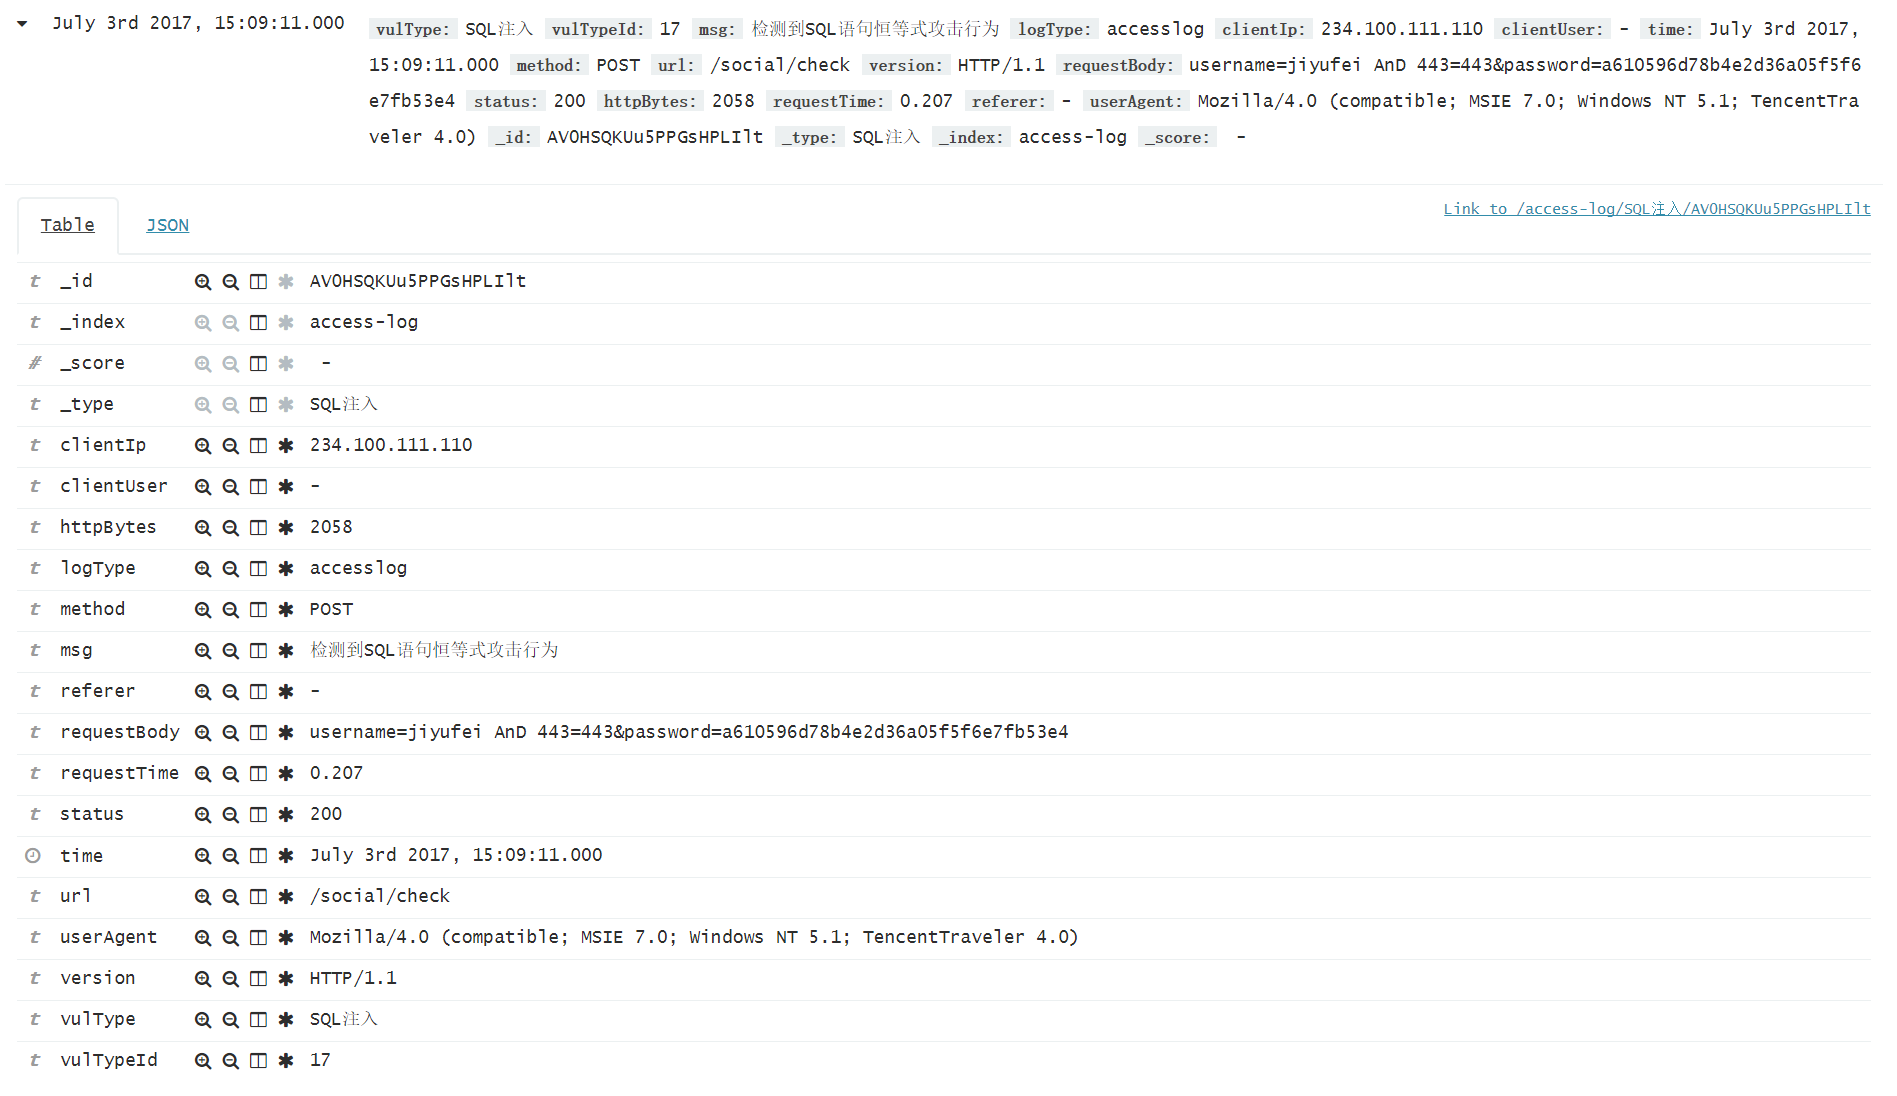
伪造一些日志,可以在kibana中看到jstorm执行后的结果
以上是jstorm实时检测的流程。还有一路是spark通过MR分析多条日志,进行统计规则的检测。
spark首先去hbase中读取数据,随后进行Map/Reduce,统计出触发风险规则的日志。例如测试统计三分钟内访问次数超过10次的IP。
获取hbase中的accesslog
随后将accesslog映射到类AccessLog中
映射完成后调用analysesIp()进行Map/Reduce操作,并将命中的IP写入到ES中
用到两个简单的map/reduce函数,一个进行初始化,将单个IP初始化一个元组(IP,1)
第二个将相同的IP进行累加,并记录出现的次数,累加后的效果为(IP1,10) (IP2,3)
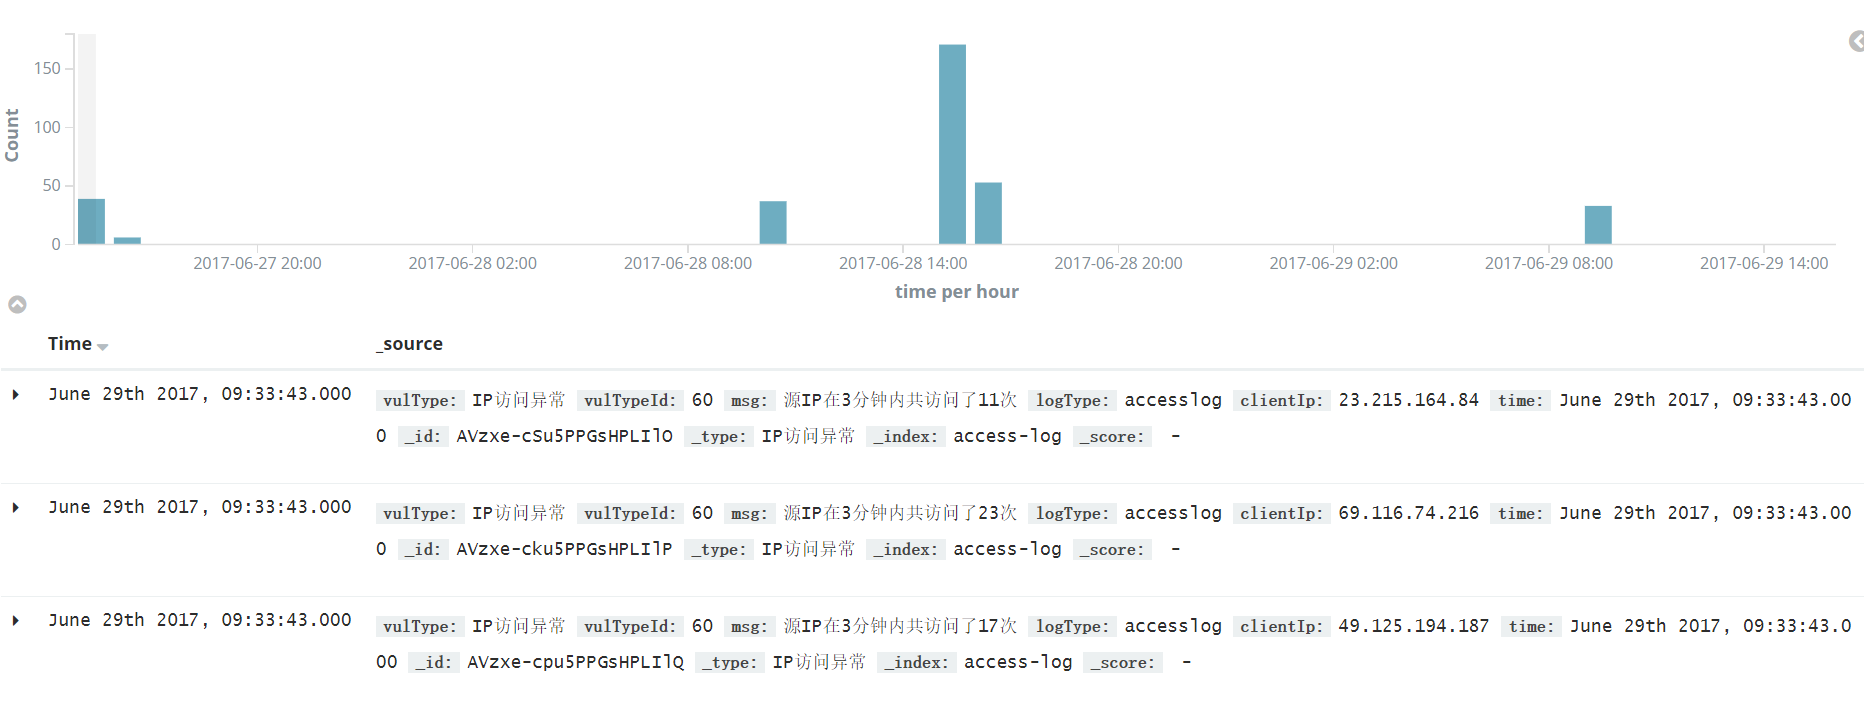
写入ES后,可看到的效果如下
注意:创建完access-log后,在写入数据前,需要运行以下命令,"time"为时间字段,"vulType"为_type
curl -XPUT '192.168.32.32:9200/access-log?pretty' -H 'Content-Type: application/json' -d'
{
"mappings": {
"vulType": {
"properties": {
"time": {
"type":   "date",
"format": "date_time_no_millis"
}
}
}
}
}
'
伪造一些日志,可以在kibana中看到jstorm执行后的结果
以上是jstorm实时检测的流程。还有一路是spark通过MR分析多条日志,进行统计规则的检测。
spark首先去hbase中读取数据,随后进行Map/Reduce,统计出触发风险规则的日志。例如测试统计三分钟内访问次数超过10次的IP。
获取hbase中的accesslog
public List<String> getTableByDate(String startRow,String endRow){
Scan s = new Scan();
List<String> logList = new ArrayList<String>();
s.setStartRow(Bytes.toBytes(startRow));
s.setStopRow(Bytes.toBytes(endRow));
try {
ResultScanner resultScanner = table.getScanner(s);
for(Result rs:resultScanner){
NavigableMap<byte[], NavigableMap<byte[], NavigableMap<Long, byte[]>>> navigableMap = rs.getMap();
for(Map.Entry<byte[], NavigableMap<byte[], NavigableMap<Long, byte[]>>> entry:navigableMap.entrySet()){
NavigableMap<byte[], NavigableMap<Long, byte[]>> map =entry.getValue();
for(Map.Entry<byte[], NavigableMap<Long, byte[]>> en:map.entrySet()){
NavigableMap<Long, byte[]> ma = en.getValue();
for(Map.Entry<Long, byte[]>e: ma.entrySet()){
logList.add(Bytes.toString(e.getValue()));
}
}
}
}
} catch (IOException e) {
e.printStackTrace();
return null;
}
return logList;
随后将accesslog映射到类AccessLog中
public void analysesLog(String startKey,String endKey){
logList = hbaseOperator.getTableByDate(startKey, endKey);
listLength = logList.size();
accesslogList = new ArrayList<AccessLog>(listLength);
String patternstr = "((\\d+\\.){3}\\d+)\\s(\\S+)\\s\\[(.+)\\]\\s\"((\\S+)\\s(.*)\\s(\\S+))\"\\s\"(.*)\"\\s(\\d+)\\s(\\d+)\\s(\\S+)\\s\"(.*)\"\\s\"(.*)\"";
pattern = Pattern.compile(patternstr);
for(int i=0;i<listLength;i++){
m = pattern.matcher(logList.get(i));
if(m.find()){
AccessLog accessLog = new AccessLog();
accessLog.setLogType("access-log");
accessLog.setClientIp(m.group(1));
accessLog.setClientUser(m.group(3));
SimpleDateFormat sdf2 = new SimpleDateFormat("yyyy-MM-dd'T'HH:mm:ssZZ");
SimpleDateFormat sdf = new SimpleDateFormat("dd/MMM/yyyy:HH:mm:ss ZZ",Locale.ENGLISH);
Date time = null;
try {
time = sdf.parse(m.group(4));
accessLog.setTime(sdf2.format(time));
} catch (ParseException e) {
accessLog.setTime(sdf2.format(new Date()));
//logger.error("[LogSplit.execute]:" + e.getMessage());
}
accessLog.setMethod(m.group(6));
accessLog.setUrl(m.group(7));
accessLog.setVersion(m.group(8));
accessLog.setRequestBody(m.group(9));
accessLog.setStatus(m.group(10));
accessLog.setHttpBytes(m.group(11));
accessLog.setRequestTime(m.group(12));
accessLog.setReferer(m.group(13));
accessLog.setUserAgent(m.group(14));
accesslogList.add(accessLog);
}
}
analysesIp();

}
映射完成后调用analysesIp()进行Map/Reduce操作,并将命中的IP写入到ES中
public void analysesIp(){
if(!accesslogList.isEmpty()){
List<String> ipList = new ArrayList<String>(listLength);
Iterator<AccessLog> iterator = accesslogList.iterator();
while (iterator.hasNext()) {
ipList.add(iterator.next().getClientIp());
}
JavaRDD<String> ipRdd = sparkContext.parallelize(ipList);
JavaPairRDD<String, Integer> clientIpRdd = ipRdd.mapToPair(initCount);
JavaPairRDD<String, Integer> sumRdd = clientIpRdd.reduceByKey(sum);
Map<String, Integer> ipMap = sumRdd.collectAsMap();
SimpleDateFormat sdf2 = new SimpleDateFormat("yyyy-MM-dd'T'HH:mm:ssZZ");
AccessLog accessLog = new AccessLog();
accessLog.setLogType("accesslog");
accessLog.setVulType("IP访问异常");
accessLog.setVulTypeId(Integer.toString(RuleLength.START_RULE_LENGTH));
for(Entry<String, Integer> entry:ipMap.entrySet()){
if(entry.getValue() > 30){
accessLog.setTime(sdf2.format(new Date()));
accessLog.setClientIp(entry.getKey());
accessLog.setMsg("源IP在3分钟内共访问了" + entry.getValue() + "次");
elasticSearch.inputData(accessLog);
}
}

}
}
用到两个简单的map/reduce函数,一个进行初始化,将单个IP初始化一个元组(IP,1)
第二个将相同的IP进行累加,并记录出现的次数,累加后的效果为(IP1,10) (IP2,3)
private static PairFunction<String, String, Integer> initCount = new PairFunction<String, String, Integer>() {

/**
*
*/
private static final long serialVersionUID = -6290488020645730311L;

public Tuple2<String, Integer> call(String x){
return new Tuple2<String, Integer>(x, 1);
}
};

private static Function2<Integer, Integer, Integer> sum = new Function2<Integer, Integer, Integer>() {

/**
*
*/
private static final long serialVersionUID = 391813718009018019L;

@Override
public Integer call(Integer x, Integer y) throws Exception {

return x + y;
}
};
写入ES后,可看到的效果如下

相关文章推荐
- ELK(ElasticSearch, Logstash, Kibana)搭建实时日志分析平台笔记
- 实时日志分析平台搭建笔记(一)
- ELK(ElasticSearch, Logstash, Kibana)搭建实时日志分析平台
- ELK(ElasticSearch, Logstash, Kibana)搭建实时日志分析平台
- ELK(ElasticSearch, Logstash, Kibana)搭建实时日志分析平台
- ELK(ElasticSearch, Logstash, Kibana)搭建实时日志分析平台
- ELK(ElasticSearch, Logstash, Kibana)搭建实时日志分析平台
- elk实时日志分析平台部署搭建详细实现过程
- ELK(ElasticSearch, Logstash, Kibana)搭建实时日志分析平台
- 【转】ELK(ElasticSearch, Logstash, Kibana)搭建实时日志分析平台
- elk实时日志分析平台部署搭建详细实现过程:加上个人实践意见,及如何避坑
- ELK(ElasticSearch, Logstash, Kibana)搭建实时日志分析平台
- ELK(ElasticSearch, Logstash, Kibana)搭建实时日志分析平台
- ELK(ElasticSearch, Logstash, Kibana)搭建实时日志分析平台
- ELK(ElasticSearch, Logstash, Kibana)搭建实时日志分析平台
- ELK(ElasticSearch+Logstash+ Kibana)搭建实时日志分析平台
- ELK(ElasticSearch, Logstash, Kibana)搭建实时日志分析平台
- ELK(ElasticSearch, Logstash, Kibana)搭建实时日志分析平台
- ELK(ElasticSearch+Logstash+ Kibana)搭建实时日志分析平台
- ELK(ElasticSearch2.1, Logstash, Kibana)搭建实时日志分析平台