python进行数据分析 chapter 2-1
2017-06-21 16:40
357 查看
1 python代码与pandas计数
下载来自bit.ly的1.usa.gov数据,这组数据显示的是网民上网记录,包括浏览的网址,所在地区、电话、操作系统等记录,文件中各行的格式为JSON(JavaScript object notation,一种常见的web数据格式),下面就开启学霸模式吧~1.1 下载数据
path ='E:\python\pythonDataAnalysis\pydata-book-master\ch02\
\usagov_bitly_data2012-03-16-1331923249.txt'
#读取文本文件第一行数据
open(path).readline()
'{ "a": "Mozilla\\/5.0 (Windows NT 6.1; WOW64) AppleWebKit\\/535.11 (KHTML, like Gecko) Chrome\\/17.0.963.78 Safari\\/535.11", "c": "US", "nk": 1, "tz": "America\\/New_York", "gr": "MA", "g": "A6qOVH", "h": "wfLQtf", "l": "orofrog", "al": "en-US,en;q=0.8", "hh": "1.usa.gov", "r": "http:\\/\\/www.facebook.com\\/l\\/7AQEFzjSi\\/1.usa.gov\\/wfLQtf", "u": "http:\\/\\/www.ncbi.nlm.nih.gov\\/pubmed\\/22415991", "t": 1331923247, "hc": 1331822918, "cy": "Danvers", "ll": [ 42.576698, -70.954903 ] }\n'1.2 将JSON字符串转换成python字典对象
import json
path ='E:\python\pythonDataAnalysis\pydata-book-master\ch02\
\usagov_bitly_data2012-03-16-1331923249.txt'
#下式称为列表推导式,这是一种在一组对象上,执行相同操作的简洁方式
records = [json.loads(line)  for line in open(path)]

#注意 打印形式和索引形式展现的不太一样,索引形式会对关键字排序!
print records[0]
records[0]
{u'a': u'Mozilla/5.0 (Windows NT 6.1; WOW64) AppleWebKit/535.11 (KHTML, like Gecko) Chrome/17.0.963.78 Safari/535.11', u'c': u'US', u'nk': 1, u'tz': u'America/New_York', u'gr': u'MA', u'g': u'A6qOVH', u'h': u'wfLQtf', u'cy': u'Danvers', u'l': u'orofrog', u'al': u'en-US,en;q=0.8', u'hh': u'1.usa.gov', u'r': u'http://www.facebook.com/l/7AQEFzjSi/1.usa.gov/wfLQtf', u'u': u'http://www.ncbi.nlm.nih.gov/pubmed/22415991', u't': 1331923247, u'hc': 1331822918, u'll': [42.576698, -70.954903]}{u'a': u'Mozilla/5.0 (Windows NT 6.1; WOW64) AppleWebKit/535.11 (KHTML, like Gecko) Chrome/17.0.963.78 Safari/535.11',
u'al': u'en-US,en;q=0.8',
u'c': u'US',
u'cy': u'Danvers',
u'g': u'A6qOVH',
u'gr': u'MA',
u'h': u'wfLQtf',
u'hc': 1331822918,
u'hh': u'1.usa.gov',
u'l': u'orofrog',
u'll': [42.576698, -70.954903],
u'nk': 1,
u'r': u'http://www.facebook.com/l/7AQEFzjSi/1.usa.gov/wfLQtf',
u't': 1331923247,
u'tz': u'America/New_York',
u'u': u'http://www.ncbi.nlm.nih.gov/pubmed/22415991'}1.3 利用python 语句对某个字典关键字出现的顺序计数
import datetime
starttime = datetime.datetime.now()
#列表推导式是对一组对象中每个对象执行相同的操作,当第一个对象中没有‘tz’时,
#如果不加后边的if判断语句,程序会报错!
time_zones = [rec['tz'] for rec in records if 'tz' in rec]
endtime = datetime.datetime.now()
print 'cost time\n',endtime - starttime
#注意存在空字符!
time_zones[:10]
cost time
0:00:00.008000
[u'America/New_York',
u'America/Denver',
u'America/New_York',
u'America/Sao_Paulo',
u'America/New_York',
u'America/New_York',
u'Europe/Warsaw',
u'',
u'',
u'']
一种常用的,统计某个关键字对应项例如({“a”:1,”a”:2,”a”:1},统计1的个数)的个数:
def get_counts(sequence):
counts = {}
#提取关键字不同对应对象
for i in sequence:
#判断该对象是否已经存入counts字典中
if i in counts:
counts[i] += 1
else:
counts[i] = 1
return counts

#使用python标准库,简化程序
from collections import defaultdict
def get_counts2(sequence):
#利用defaultdict可以直接初始化counts的关键字对应的对象都为0或者其他值
counts = defaultdict(int)
for i in sequence:
counts[i] += 1
return counts

counts1 = get_counts(time_zones)
counts2 = get_counts2(time_zones)
print counts1['America/New_York']
print counts2['America/New_York']
1251 1251
选取前10个最多个数的对象
def top_counts(count_dict,n=10):
value_key_pairs = [(count, tz) for tz ,count in count_dict.items()]
value_key_pairs.sort(reverse = True)#降序,默认升序
return value_key_pairs[:10]
top_counts(counts1)
[(1251, u'America/New_York'),
(521, u''),
(400, u'America/Chicago'),
(382, u'America/Los_Angeles'),
(191, u'America/Denver'),
(74, u'Europe/London'),
(37, u'Asia/Tokyo'),
(36, u'Pacific/Honolulu'),
(35, u'Europe/Madrid'),
(33, u'America/Sao_Paulo')]
一种简单的方式,使用python标准库
from collections import Counter
counts = Counter(time_zones)
counts.most_common(10)
[(u'America/New_York', 1251),
(u'', 521),
(u'America/Chicago', 400),
(u'America/Los_Angeles', 382),
(u'America/Denver', 191),
(u'Europe/London', 74),
(u'Asia/Tokyo', 37),
(u'Pacific/Honolulu', 36),
(u'Europe/Madrid', 35),
(u'America/Sao_Paulo', 33)]
1.4 利用pandas库进行计数
import pandas as pd
import numpy as np
from pandas import DataFrame,Series
frame = DataFrame(records)

print frame['tz'][:10]
print frame.columns
0     America/New_York
1       America/Denver
2     America/New_York
3    America/Sao_Paulo
4     America/New_York
5     America/New_York
6        Europe/Warsaw
7
8
9
Name: tz, dtype: object
Index([u'_heartbeat_', u'a', u'al', u'c', u'cy', u'g', u'gr', u'h', u'hc',
u'hh', u'kw', u'l', u'll', u'nk', u'r', u't', u'tz', u'u'],
dtype='object')
frame[‘tz’]返回的是一个Serise对象,该对象有一个value_counts方法
tz_counts = frame['tz'].value_counts()
tz_counts[:10]
America/New_York       1251
521
America/Chicago         400
America/Los_Angeles     382
America/Denver          191
Europe/London            74
Asia/Tokyo               37
Pacific/Honolulu         36
Europe/Madrid            35
America/Sao_Paulo        33
Name: tz, dtype: int64
第二个为缺失值需要替换
#这里需注意缺失值NA,与空字符,或者其他字符有区别,fillna,dropna函数只适合处理缺失值NA,NULL
clean_tz = frame['tz'].fillna('Missing')
clean_tz[clean_tz == ''] = 'unknown'
tz_counts = clean_tz.value_counts()
print clean_tz[:10]
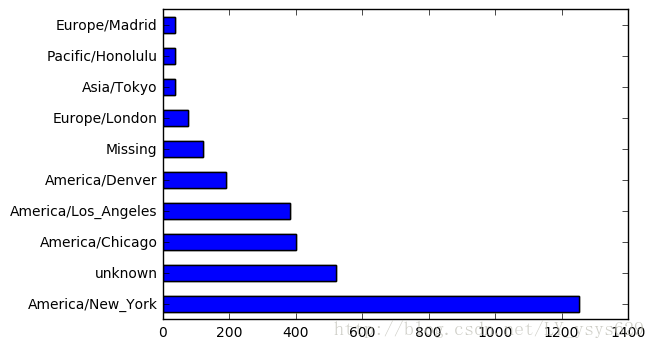
print tz_counts[:10]0 America/New_York 1 America/Denver 2 America/New_York 3 America/Sao_Paulo 4 America/New_York 5 America/New_York 6 Europe/Warsaw 7 unknown 8 unknown 9 unknown Name: tz, dtype: object America/New_York 1251 unknown 521 America/Chicago 400 America/Los_Angeles 382 America/Denver 191 Missing 120 Europe/London 74 Asia/Tokyo 37 Pacific/Honolulu 36 Europe/Madrid 35 Name: tz, dtype: int64
画出柱形图
import matplotlib.pyplot as plt
#注意plt.plot与DataFrame.plot不同!
tz_counts[:10].plot(kind='barh',rot=0)
plt.show()

1.5 python字符串函数与正则化表达
frame['a'][1]
u'GoogleMaps/RochesterNY'
frame.a[1]
u'GoogleMaps/RochesterNY'
results = [x.split()[0] for x in frame.a.dropna()]
results[:5]
[u'Mozilla/5.0',
u'GoogleMaps/RochesterNY',
u'Mozilla/4.0',
u'Mozilla/5.0',
u'Mozilla/5.0']
#将frame关键字为a的对象中第一个空格之前的字符串取出来
results = Series([x.split()[0] for x in frame.a.dropna()])
results[:5]
0               Mozilla/5.0
1    GoogleMaps/RochesterNY
2               Mozilla/4.0
3               Mozilla/5.0
4               Mozilla/5.0
dtype: object
从上述结果中可以看出,series结构是带有索引的一维数组
results.value_counts()[:8]
Mozilla/5.0                 2594
Mozilla/4.0                  601
GoogleMaps/RochesterNY       121
Opera/9.80                    34
TEST_INTERNET_AGENT           24
GoogleProducer                21
Mozilla/6.0                    5
BlackBerry8520/5.0.0.681       4
dtype: int64
上述结果可以看出series数据结构能够轻松将展示一些统计结果,便于我们理解和分析数据。
frame.a.notnull()[:5]
0    True
1    True
2    True
3    True
4    True
Name: a, dtype: bool
#去除缺失值
cframe = frame[frame.a.notnull()]
cframe.a.str[:][:5]#str类是pandas一个处理字符串的核心库,可以被Series,DataFrame等结构调用。
0    Mozilla/5.0 (Windows NT 6.1; WOW64) AppleWebKi...
1                               GoogleMaps/RochesterNY
2    Mozilla/4.0 (compatible; MSIE 8.0; Windows NT ...
3    Mozilla/5.0 (Macintosh; Intel Mac OS X 10_6_8)...
4    Mozilla/5.0 (Windows NT 6.1; WOW64) AppleWebKi...
Name: a, dtype: object
#得到一列新的列表
operating_system = Series(np.where(cframe['a'].str.contains('Windows'),'Windows','Not Windows'))
operating_system[:5]
0 Windows 1 Not Windows 2 Windows 3 Not Windows 4 Windows dtype: object
by_tz_os = cframe.groupby(['tz',operating_system])#一般groupby需要与聚合函数一起使用
by_tz_os.size()[:5]
tz
Africa/Cairo       Not Windows    1
Windows        2
Africa/Casablanca  Windows        1
Africa/Ceuta       Not Windows    1
Windows        1
dtype: int64
agg_counts = by_tz_os.size().unstack().fillna(0)
agg_counts[:5]
| Not Windows | Windows | |
|---|---|---|
| tz | ||
| Africa/Cairo | 1.0 | 2.0 |
| Africa/Casablanca | 0.0 | 1.0 |
| Africa/Ceuta | 1.0 | 1.0 |
| Africa/Johannesburg | 0.0 | 1.0 |
| Africa/Lusaka | 1.0 | 0.0 |
indexer =agg_counts.sum(1)[:5]#按行求和
indexer[:10]
tz
Africa/Cairo           3.0
Africa/Casablanca      1.0
Africa/Ceuta           2.0
Africa/Johannesburg    1.0
Africa/Lusaka          1.0
dtype: float64
cframe.groupby(['tz']).size()[:5]
tz
Africa/Cairo           3
Africa/Casablanca      1
Africa/Ceuta           2
Africa/Johannesburg    1
Africa/Lusaka          1
dtype: int64
可以看出上述两种方式的结果相同
indexer =agg_counts.sum(1).argsort()#返回求和值升序下标
indexer[:10]
tz
Africa/Cairo                      74
Africa/Casablanca                 53
Africa/Ceuta                      35
Africa/Johannesburg               54
Africa/Lusaka                     33
America/Anchorage                 55
America/Argentina/Buenos_Aires    51
America/Argentina/Cordoba         58
America/Argentina/Mendoza         60
America/Bogota                    26
dtype: int64
count_subset = agg_counts.take(indexer)[-10:]#利用take方法和下标调整agg_counts
count_subset
| Not Windows | Windows | |
|---|---|---|
| tz | ||
| America/Sao_Paulo | 12.0 | 21.0 |
| Europe/Madrid | 15.0 | 19.0 |
| Pacific/Honolulu | 10.0 | 25.0 |
| Asia/Tokyo | 14.0 | 23.0 |
| Europe/London | 32.0 | 40.0 |
| America/Denver | 56.0 | 125.0 |
| America/Los_Angeles | 122.0 | 247.0 |
| America/Chicago | 131.0 | 249.0 |
| unknown | 180.0 | 316.0 |
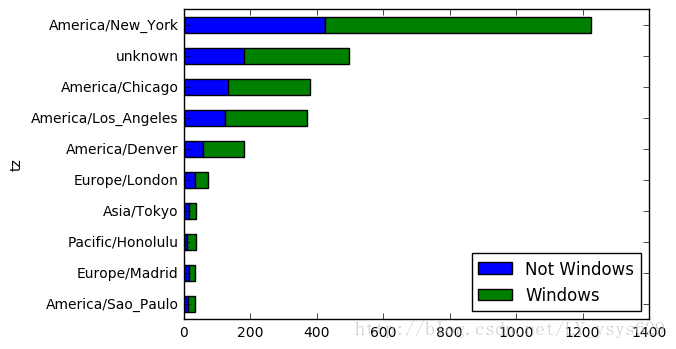
| America/New_York | 426.0 | 798.0 |
count_subset.plot(kind = 'barh',stacked = True)
plt.show()
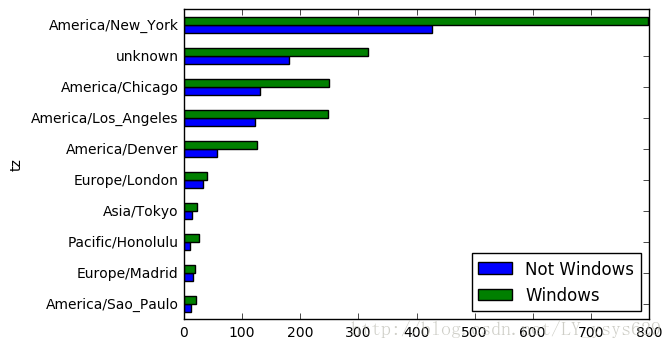
count_subset.plot(kind = 'barh',stacked = True)
plt.show()
2 总结
本部分内容,主要利用python内置标准库以及pandas工具包来对网民上网记录进行简单分析,及可视化分析结果,体现了python做数据分析的强大之处!
相关文章推荐
- 利用Python进行数据分析——时间序列[十](1) .
- 利用Python进行数据分析——数据规整化:清理、转换、合并、重塑(七)(1)
- 利用python进行数据分析之pandas库的应用(一)
- 利用python进行数据分析-关于包的坑
- 利用python进行数据分析之绘图和可视化
- 利用python进行数据分析之数据规整化
- 利用Python进行数据分析——数据规整化:清理、转换、合并、重塑(七)(5) .
- 使用python进行数据分析
- 利用python进行数据分析之pandas库的应用(二)
- 利用Python进行数据分析--数据聚合与分组运算
- 利用Python进行数据分析——第一章:重要Python库安装配置
- 使用python中的matplotlib进行绘图分析数据
- 《利用python 进行数据分析》要点记录
- 利用Python进行数据分析——准备工作篇
- 利用Python进行数据分析--绘图和可视化
- matplotlib -- 使用python中的matplotlib进行绘图分析数据
- 利用Python进行数据分析--数据规整化:清理、转换、合并、重塑
- 利用Python进行数据分析---ch02《MovieLens 1M数据集(上)》读书笔记
- 利用python进行数据分析笔记
- 利用python进行数据分析之数据加载存储与文件格式