ELK+redis搭建日志分析平台
2017-05-18 15:40
357 查看
ELK+redis搭建日志分析平台
1.ELK简介
ELKStack即Elasticsearch + Logstash + Kibana。日志监控和分析在保障业务稳定运行时,起到了很重要的作用。比如对nginx日志的监控分析,nginx是有日志文件的,它的每个请求的状态等都有日志文件进行记录,所以可以通过读取日志文件来分析;redis的list结构正好可以作为队列使用,用来存储logstash传输的日志数据。然后elasticsearch就可以进行分析和查询了。
本文搭建的的是一个分布式的日志收集和分析系统。logstash有agent和indexer两个角色。对于agent角色,放在单独的web机器上面,然后这个agent不断地读取nginx的日志文件,每当它读到新的日志信息以后,就将日志传送到网络上的一台redis队列上。对于队列上的这些未处理的日志,有不同的几台logstash indexer进行接收和分析。分析之后存储到elasticsearch进行搜索分析。再由统一的kibana进行日志web界面的展示。
broker一般选择redis。不过我见过很多运用场景里都没有用 logstash 作为 shipper(也是agent的概念),或者说没有用 elasticsearch 作为数据存储也就是说也没有 indexer。所以,我们其实不需要这些概念。只需要学好怎么使用和配置 logstash 进程,然后把它运用到你的日志管理架构中最合适它的位置就够了。
2.软件环境
jdk 1.8.0_20
redis-2.8.20.tar.gz
elasticsearch-1.7.1.tar.gz
logstash-1.5.3.tar.gz
kibana-4.1.1-linux-x64.tar.gz
3.Redis安装
执行如下步骤进行安装:
启动:
nohup redis-server /etc/redis/redis.conf >/etc/redis/nohup.out &
4.Elasticserach安装
ElasticSearch默认的对外服务的HTTP端口是9200,节点间交互的TCP端口是9300,注意打开tcp端口。
4.1Elasticsearch安装
从官网下载最新版本的tar包,并进行安装:
4.2配置文件
elasticsearch的配置文件位于:<elasticsearch_dir>/config/elasticsearch.yml
默认是全注释的(不作任何修改也可正常使用),可做如下修改:
配置文件详解
4.3安装插件(可选)
可以在线安装Head插件:
#cd <elasticsearch_dir>
#./bin/plugin install mobz/elasticsearch-head
Elasticsearch-kopf插件可以查询Elasticsearch中的数据:
#./bin/plugin install lmenezes/elasticsearch-kopf
4.4启动
# elasticsearch start -d
4.5测试
出现200返回码表示ok
5.Logstash安装
Logstash默认的对外端口是9292,如果防火墙开启了要打开tcp端口。
5.1源码安装
执行如下命令进行安装:
5.2yum安装
还可以采用yum的方式安装
5.3测试
然后你会发现终端在等待你的输入。
敲入 Hello World,回车,然后看看会返回什么结果!
5.4设置日志格式
本次要监控nginx和apache,需要修改nginx.conf和httpd.conf,设置日志格式。
修改nginx.conf
修改httpd.conf
5.5配置logstash agent
5.5.1配置文件
logstash agent负责收集日志信息传送到redis队列上。本次收集apache,nginx两处日志:
# cd /usr/local/elk/logstash-1.5.3/
# mkdir etc
# vi logstash_agent.conf
加入如下内容:
5.5.2input常用字段
input file部分还有如下可选字段:
5.5.3启动
启动logstash agent:
# nohup /usr/local/elk/logstash-1.5.3/bin/logstash -f /usr/local/elk/logstash-1.5.3/etc/logstash_agent.conf &
5.6配置logstash indexer
5.6.1配置文件
indexer负责将redis里的日志导入到elasticsearch里进行搜索:
#cd /usr/local/elk/logstash-1.5.3/etc
#vi logstash_indexer.conf
加入如下内容:
注意:
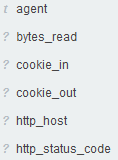
grok规则编写时要注意字段要和日志格式一一对应。定义成功的才会在kibana中显示定义的字段,不成功则不会显示。如下为定义成功的apache的部分规则。
5.6.2启动
启动logstash indexer
nohup /usr/local/elk/logstash-1.5.3/bin/logstash -f /usr/local/elk/logstash-1.5.3/etc/logstash_indexer.conf &
6.Kibana安装
kibana本质上是elasticsearch web客户端,是一个分析和可视化elasticsearch平台,可通过kibana搜索、查看和与存储在elasticsearch的索引进行交互。可以很方便的执行先进的数据分析和可视化多种格式的数据,如图表、表格、地图等。
6.1下载安装
kibana负责将elasticsearch搜索的结果进行展示。
# wget https://download.elastic.co/kibana/kibana/kibana-4.1.1-linux-x64.tar.gz # tar -zxvf kibana-4.1.1-linux-x64.tar.gz
# mv kibana-4.1.1-linux-x64 /usr/local/elk
# 启动
# cd /usr/local/elk/kibana/bin
# ./kibana &
kibana监听的端口为5601.
6.2配置文件
kibana的配置文件位于<kibana_dir>/config/kibana.yml
可自定义IP、端口、elasticsearch_url等。
7.ELK+redis测试
如果ELK+redis都没启动,以下命令启动:
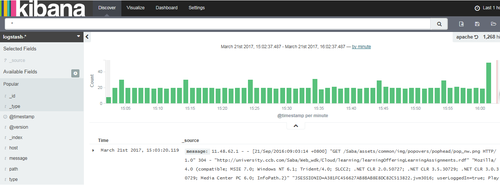
打开kibana页面:http://192.168.100.191:5601,即可看到界面。
1.ELK简介
ELKStack即Elasticsearch + Logstash + Kibana。日志监控和分析在保障业务稳定运行时,起到了很重要的作用。比如对nginx日志的监控分析,nginx是有日志文件的,它的每个请求的状态等都有日志文件进行记录,所以可以通过读取日志文件来分析;redis的list结构正好可以作为队列使用,用来存储logstash传输的日志数据。然后elasticsearch就可以进行分析和查询了。
本文搭建的的是一个分布式的日志收集和分析系统。logstash有agent和indexer两个角色。对于agent角色,放在单独的web机器上面,然后这个agent不断地读取nginx的日志文件,每当它读到新的日志信息以后,就将日志传送到网络上的一台redis队列上。对于队列上的这些未处理的日志,有不同的几台logstash indexer进行接收和分析。分析之后存储到elasticsearch进行搜索分析。再由统一的kibana进行日志web界面的展示。
broker一般选择redis。不过我见过很多运用场景里都没有用 logstash 作为 shipper(也是agent的概念),或者说没有用 elasticsearch 作为数据存储也就是说也没有 indexer。所以,我们其实不需要这些概念。只需要学好怎么使用和配置 logstash 进程,然后把它运用到你的日志管理架构中最合适它的位置就够了。
2.软件环境
jdk 1.8.0_20
redis-2.8.20.tar.gz
elasticsearch-1.7.1.tar.gz
logstash-1.5.3.tar.gz
kibana-4.1.1-linux-x64.tar.gz
3.Redis安装
执行如下步骤进行安装:
| #tar zxvf redis-2.8.20.tar.gz#cd redis-2.8.20#make#make install |
nohup redis-server /etc/redis/redis.conf >/etc/redis/nohup.out &
4.Elasticserach安装
ElasticSearch默认的对外服务的HTTP端口是9200,节点间交互的TCP端口是9300,注意打开tcp端口。
4.1Elasticsearch安装
从官网下载最新版本的tar包,并进行安装:
| # wget https://download.elastic.co/elasticsearch/elasticsearch/elasticsearch-1.7.1.tar.gz # mkdir /usr/local/elk # tar zxf elasticsearch-1.7.1.tar.gz -C /usr/local/elk/ # ln -s /usr/local/elk/elasticsearch-1.7.1/bin/elasticsearch /usr/bin |
elasticsearch的配置文件位于:<elasticsearch_dir>/config/elasticsearch.yml
默认是全注释的(不作任何修改也可正常使用),可做如下修改:
| cluster.name=es_clusternode.name=node0path.data=/data/elasticsearch/datapath.logs=/data/elasticsearch/logs #当前hostname或IP,我这里是elknetwork.host=elknetwork.port=9200 |
| cluster.name:elasticsearch ↑配置es的集群名称,默认是elasticsearch,es会自动发现在同一网段下的es,如果在同一网段下有多个集群,就可以用这个属性来区分不同的集群。 node.name:”FranzKafka” ↑节点名,默认随机指定一个name列表中名字,该列表在es的jar包中config文件夹里name.txt文件中,其中有很多作者添加的有趣名字。 node.master:true ↑指定该节点是否有资格被选举成为node,默认是true,es是默认集群中的第一台机器为master,如果这台机挂了就会重新选举master。 node.data:true ↑指定该节点是否存储索引数据,默认为true。 index.number_of_shards:5 ↑设置默认索引分片个数,默认为5片。 index.number_of_replicas:1 ↑设置默认索引副本个数,默认为1个副本。 path.conf:/path/to/conf ↑设置配置文件的存储路径,默认是es根目录下的config文件夹。 path.data:/path/to/data ↑设置索引数据的存储路径,默认是es根目录下的data文件夹,可以设置多个存储路径,用逗号隔开,例: path.data:/path/to/data1,/path/to/data2 path.work:/path/to/work ↑设置临时文件的存储路径,默认是es根目录下的work文件夹。 path.logs:/path/to/logs ↑设置日志文件的存储路径,默认是es根目录下的logs文件夹 path.plugins:/path/to/plugins ↑设置插件的存放路径,默认是es根目录下的plugins文件夹 bootstrap.mlockall:true ↑设置为true来锁住内存。因为当jvm开始swapping时es的效率会降低,所以要保证它不swap,可以把ES_MIN_MEM和ES_MAX_MEM两个环境变量设置成同一个值,并且保证机器有足够的内存分配给es。同时也要允许elasticsearch的进程可以锁住内存,linux下可以通过`ulimit-lunlimited`命令。 network.bind_host:192.168.0.1 ↑设置绑定的ip地址,可以是ipv4或ipv6的,默认为0.0.0.0。network.publish_host:192.168.0.1 设置其它节点和该节点交互的ip地址,如果不设置它会自动判断,值必须是个真实的ip地址。 network.host:192.168.0.1 ↑这个参数是用来同时设置bind_host和publish_host上面两个参数。 transport.tcp.port:9300 ↑设置节点间交互的tcp端口,默认是9300。 transport.tcp.compress:true ↑设置是否压缩tcp传输时的数据,默认为false,不压缩。 http.port:9200 ↑设置对外服务的http端口,默认为9200。 http.max_content_length:100mb ↑设置内容的最大容量,默认100mb http.enabled:false ↑是否使用http协议对外提供服务,默认为true,开启。 gateway.type:local ↑gateway的类型,默认为local即为本地文件系统,可以设置为本地文件系统,分布式文件系统,hadoop的HDFS,和amazon的s3服务器,其它文件系统的设置方法下次再详细说。 gateway.recover_after_nodes:1 ↑设置集群中N个节点启动时进行数据恢复,默认为1。 gateway.recover_after_time:5m ↑设置初始化数据恢复进程的超时时间,默认是5分钟。 gateway.expected_nodes:2 ↑设置这个集群中节点的数量,默认为2,一旦这N个节点启动,就会立即进行数据恢复。 cluster.routing.allocation.node_initial_primaries_recoveries:4 ↑初始化数据恢复时,并发恢复线程的个数,默认为4。 cluster.routing.allocation.node_concurrent_recoveries:2 ↑添加删除节点或负载均衡时并发恢复线程的个数,默认为4。 indices.recovery.max_size_per_sec:0 ↑设置数据恢复时限制的带宽,如入100mb,默认为0,即无限制。 indices.recovery.concurrent_streams:5 ↑设置这个参数来限制从其它分片恢复数据时最大同时打开并发流的个数,默认为5。 discovery.zen.minimum_master_nodes:1 ↑设置这个参数来保证集群中的节点可以知道其它N个有master资格的节点。默认为1,对于大的集群来说,可以设置大一点的值(2-4) discovery.zen.ping.timeout:3s ↑设置集群中自动发现其它节点时ping连接超时时间,默认为3秒,对于比较差的网络环境可以高点的值来防止自动发现时出错。 discovery.zen.ping.multicast.enabled:false ↑设置是否打开多播发现节点,默认是true。 discovery.zen.ping.unicast.hosts:[“host1″,”host2:port”,”host3[portX-portY]”] ↑设置集群中master节点的初始列表,可以通过这些节点来自动发现新加入集群的节点 |
可以在线安装Head插件:
#cd <elasticsearch_dir>
#./bin/plugin install mobz/elasticsearch-head
Elasticsearch-kopf插件可以查询Elasticsearch中的数据:
#./bin/plugin install lmenezes/elasticsearch-kopf
4.4启动
# elasticsearch start -d
4.5测试
出现200返回码表示ok
| # elasticsearch start -d # curl -X GET http://localhost:9200 { "status" : 200, "name" : "Wasp", "cluster_name" : "elasticsearch", "version" : { "number" : "1.7.1", "build_hash" : "b88f43fc40b0bcd7f173a1f9ee2e97816de80b19", "build_timestamp" : "2015-07-29T09:54:16Z", "build_snapshot" : false, "lucene_version" : "4.10.4" }, "tagline" : "You Know, for Search" } |
Logstash默认的对外端口是9292,如果防火墙开启了要打开tcp端口。
5.1源码安装
执行如下命令进行安装:
| # wget https://download.elastic.co/logstash/logstash/logstash-1.5.3.tar.gz # tar -zxf logstash-1.5.3.tar.gz -C /usr/local/elk # mkdir /usr/local/elk/logstash-1.5.3/etc |
还可以采用yum的方式安装
| # rpm --import https://packages.elasticsearch.org/GPG-KEY-elasticsearch #download public key# vi /etc/yum.repos.d/CentOS-Base.repo [logstash-1.5] name=Logstash repository for 1.5.x packages baseurl=http://packages.elasticsearch.org/logstash/1.5/centos gpgcheck=1 gpgkey=http://packages.elasticsearch.org/GPG-KEY-elasticsearch enabled=1 # yum install logstash #yum安装会安装在/opt目录下 |
| # cd <logstash_dir>#./bin/logstash -e 'input{stdin{}}output{stdout{codec=>rubydebug}}' |
敲入 Hello World,回车,然后看看会返回什么结果!
| Hello World { "message" => "Hello World", "@version" => "1", "@timestamp" => "2017-03-21T06:45:59.349Z", "host" => "localhost.localdomain" } |
本次要监控nginx和apache,需要修改nginx.conf和httpd.conf,设置日志格式。
修改nginx.conf
| # cd <nginx_dir>/conf # vi nginx.conf #设置log_format,去掉注释 log_format main '$remote_addr - $remote_user [$time_local] "$request" ' '$status $body_bytes_sent "$http_referer" ' '"$http_user_agent" "$http_x_forwarded_for"'; access_log logs/host.access.log main; #设置access日志,有访问时自动写入此文件 # nginx -s reload |
| # cd <apache_dir>/conf# vi httpd.conf #设置如下日志格式 LogFormat "%h %l %u %t %D \"%r\" %>s %b \"%{Referer}i\" \"%{User-Agent}i\" \"%{Cookie}i\" \"%{Set-Cookie}o\"" combined |
5.5.1配置文件
logstash agent负责收集日志信息传送到redis队列上。本次收集apache,nginx两处日志:
# cd /usr/local/elk/logstash-1.5.3/
# mkdir etc
# vi logstash_agent.conf
加入如下内容:
| input { file { type => "apache" path => ["/log/access_log"] #↑多个源可以写成path => ["/var/log/messages","/var/log/*.log"] } file { type => "nginx" path => ["/usr/share/nginx/logs/access.log"] } } output { redis { host => "127.0.0.1" #redis server data_type => "list" key => "logstash:redis" } } |
input file部分还有如下可选字段:
| input { file { #↓监听文件的路径 path => ["/var/log/*","/log/test.log"] #排除不想监听的文件 exclude => "1.log" #↓设置多长时间扫描目录,发现新文件 discover_interval => 15 #↓设置多长时间检测文件是否修改 stat_interval => 1 #↓监听文件的起始位置,默认是end start_position => beginning #↓监听文件读取信息记录的位置 sincedb_path => "/log/add.log" #↓设置多长时间会写入读取的位置信息 sincedb_write_interval => 15 } } |
启动logstash agent:
# nohup /usr/local/elk/logstash-1.5.3/bin/logstash -f /usr/local/elk/logstash-1.5.3/etc/logstash_agent.conf &
5.6配置logstash indexer
5.6.1配置文件
indexer负责将redis里的日志导入到elasticsearch里进行搜索:
#cd /usr/local/elk/logstash-1.5.3/etc
#vi logstash_indexer.conf
加入如下内容:
| input { #↓定义源为redis redis { host => "127.0.0.1" data_type => "list" key => "logstash:redis" type => "redis-input" } } #filter部分通过if语句根据不同的type进行匹配不同的grok规则. filter { if [type] == "apache" { #↓定义apache日志的索引规则,type:apache已在logstash_agent.conf文件中定义. grok { match => [ "message", "%{IPORHOST:http_host} (%{IPORHOST:client_ip}|-) - \[%{HTTPDATE:timestamp}\] \"(?:%{WORD:http_verb} %{NOTSPACE:http_request} (?: HTTP/%{NUMBER:http_version})?|%{DATA:raw_http_request})\" %{NUMBER:http_status_code} (?:%{NUMBER:bytes_read}|-) %{QS:referrer} %{QS:agent} %{QS:cookie_in} (%{QS:cookie_out}|-)" ] } } if [type] == "nginx" { #↓定义nginx日志的索引规则,type:nginx已在logstash_agent.conf文件中定义. grok { match => [ "message", "%{IPORHOST:http_host} - - \[%{HTTPDATE:timestamp}\] \"(?:%{WORD:http_verb} %{NOTSPACE:http_request} HTTP/%{NUMBER:http_version}\" %{NUMBER:http_status_code} (?:%{NUMBER:bytes_read}|-)) %{QS:referrer} %{QS:agent} %{QS:forwarded}" ] } } } #↓output部分通过if语句根据不同的type输出成不同的索引,该索引需要在kibana中进行创建,见后续部分. output { if [type] == "apache" { elasticsearch { embedded => false protocol => "http" host => "localhost" port => "9200" index => "apache_access" } } if [type] == "nginx" { elasticsearch { embedded => false protocol => "http" host => "localhost" port => "9200" index => "nginx_access" } } } |
grok规则编写时要注意字段要和日志格式一一对应。定义成功的才会在kibana中显示定义的字段,不成功则不会显示。如下为定义成功的apache的部分规则。
5.6.2启动
启动logstash indexer
nohup /usr/local/elk/logstash-1.5.3/bin/logstash -f /usr/local/elk/logstash-1.5.3/etc/logstash_indexer.conf &
6.Kibana安装
kibana本质上是elasticsearch web客户端,是一个分析和可视化elasticsearch平台,可通过kibana搜索、查看和与存储在elasticsearch的索引进行交互。可以很方便的执行先进的数据分析和可视化多种格式的数据,如图表、表格、地图等。
6.1下载安装
kibana负责将elasticsearch搜索的结果进行展示。
# wget https://download.elastic.co/kibana/kibana/kibana-4.1.1-linux-x64.tar.gz # tar -zxvf kibana-4.1.1-linux-x64.tar.gz
# mv kibana-4.1.1-linux-x64 /usr/local/elk
# 启动
# cd /usr/local/elk/kibana/bin
# ./kibana &
kibana监听的端口为5601.
6.2配置文件
kibana的配置文件位于<kibana_dir>/config/kibana.yml
可自定义IP、端口、elasticsearch_url等。
| # Kibana is served by a back end server. This controls which port to use. port: 5601 # The host to bind the server to. host: "0.0.0.0" # The Elasticsearch instance to use for all your queries. elasticsearch_url: "http://localhost:9200" # preserve_elasticsearch_host true will send the hostname specified in `elasticsearch`. If you set it to false, # then the host you use to connect to *this* Kibana instance will be sent. elasticsearch_preserve_host: true # Kibana uses an index in Elasticsearch to store saved searches, visualizations # and dashboards. It will create a new index if it doesn't already exist. kibana_index: ".kibana" # If your Elasticsearch is protected with basic auth, this is the user credentials # used by the Kibana server to perform maintence on the kibana_index at statup. Your Kibana # users will still need to authenticate with Elasticsearch (which is proxied thorugh # the Kibana server) # kibana_elasticsearch_username: user # kibana_elasticsearch_password: pass # If your Elasticsearch requires client certificate and key # kibana_elasticsearch_client_crt: /path/to/your/client.crt # kibana_elasticsearch_client_key: /path/to/your/client.key # If you need to provide a CA certificate for your Elasticsarech instance, put # the path of the pem file here. # ca: /path/to/your/CA.pem # The default application to load. default_app_id: "discover" # Time in milliseconds to wait for elasticsearch to respond to pings, defaults to # request_timeout setting # ping_timeout: 1500 # Time in milliseconds to wait for responses from the back end or elasticsearch. # This must be > 0 request_timeout: 300000 # Time in milliseconds for Elasticsearch to wait for responses from shards. # Set to 0 to disable. shard_timeout: 0 # Time in milliseconds to wait for Elasticsearch at Kibana startup before retrying # startup_timeout: 5000 # Set to false to have a complete disregard for the validity of the SSL # certificate. verify_ssl: true # SSL for outgoing requests from the Kibana Server (PEM formatted) # ssl_key_file: /path/to/your/server.key # ssl_cert_file: /path/to/your/server.crt # Set the path to where you would like the process id file to be created. # pid_file: /var/run/kibana.pid # If you would like to send the log output to a file you can set the path below. # This will also turn off the STDOUT log output. # log_file: ./kibana.log # Plugins that are included in the build, and no longer found in the plugins/ folder bundled_plugin_ids: - plugins/dashboard/index - plugins/discover/index - plugins/doc/index - plugins/kibana/index - plugins/markdown_vis/index - plugins/metric_vis/index - plugins/settings/index - plugins/table_vis/index - plugins/vis_types/index - plugins/visualize/index |
如果ELK+redis都没启动,以下命令启动:
| #启动redis #nohup redis-server /etc/redis/redis.conf >/etc/redis/nohup.out & #启动elasticsearch #elasticsearch start -d #启动agent #cd /usr/local/elk/logstash-1.5.3 nohup ./bin/logstash -f ./etc/logstash_agent.conf > agent.out & #启动indexer #cd /usr/local/elk/logstash-1.5.3 nohup ./bin/logstash -f ./etc/logstash_indexer.conf >indexer.out& #启动kibana #cd /usr/local/elk/kibana nohup ./bin/kibana >kibana.out & |

相关文章推荐
- 使用elk+redis搭建nginx日志分析平台
- 使用elk+redis搭建nginx日志分析平台
- 使用elk+redis搭建nginx日志分析平台(转)
- 使用elk+redis搭建nginx日志分析平台
- 使用elk+redis搭建nginx日志分析平台
- ELK_elk+redis 搭建日志分析平台
- 使用ELK(logstash,elasticsearch,kibana)+redis搭建nginx日志分析平台
- elk+redis 搭建nginx日志分析平台
- elk+redis 搭建nginx日志分析平台
- linux下使用elk+redis搭建nginx日志分析平台
- elk+redis 搭建日志分析平台
- elk+redis 搭建nginx日志分析平台
- 使用elk+redis搭建nginx日志分析平台
- 使用elk+redis搭建nginx日志分析平台
- 使用elk+redis搭建nginx日志分析平台
- linux下利用elk+redis 搭建日志分析平台教程
- ELK(ElasticSearch2.1, Logstash, Kibana)搭建实时日志分析平台
- Linux搭建开源实时日志分析ELK平台
- 开源日志分析系统ELK平台搭建部署
- 在Windows系统下搭建ELK日志分析平台(ElasticSearch、Logstash和Kiabana)