简单模拟一下ab压力测试
2017-05-17 17:01
1011 查看
简单了解下ab
ab全程是apache benchmark,是apache官方推出的一个工具,创建多个并发访问线程,模拟多个访问者同时对一个URL地址进行访问。它的测试目标是基于URL的,因此它既可以来测试apache的负载压力,也可以测试Nginx等服务器的压力。
ab压力测试需要注意哪些?
测试的注意事项:
测试机器与被测试机器要分开,别在同一台机器上测试,否则结果是不准确的
不要对线上的服务器做测试,否则挂了就不好了哦。
观察测试工具ab所在的机器,以及被测试的前端机器的CPU,内存,网络等都不超过最高限度的75%。
下面测试下,两台服务器。
192.168.136.135 作为被测试的WEB服务器
192.168.136.148 作为ab测试的服务器
首先确保ab测试服务器安装ab,使用以下命令yum安装
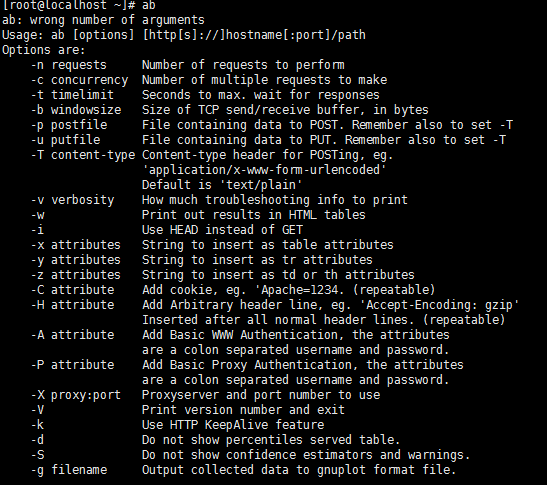
安装完成之后,执行ab命令,返回一些帮助信息,确保安装成功
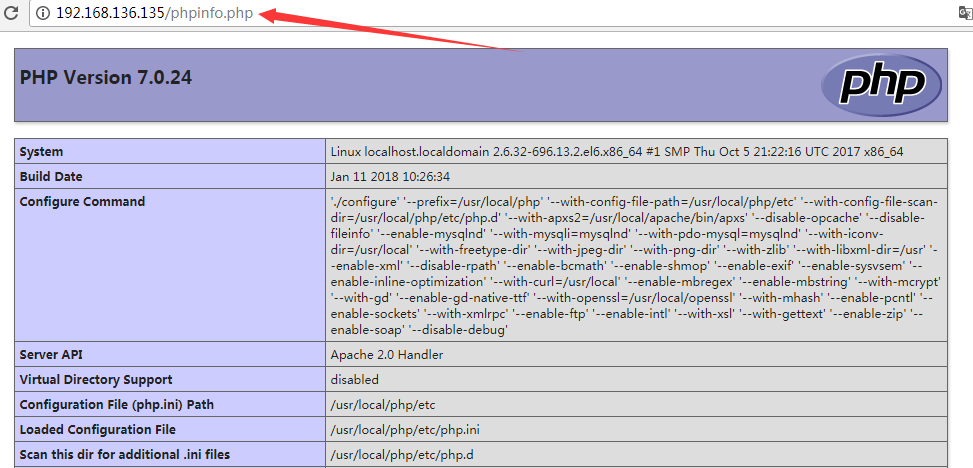
访问以下被测试的服务器,确保正常
执行下面的命令进行测试
返回的结果
把并发数改为50测试一下
ab全程是apache benchmark,是apache官方推出的一个工具,创建多个并发访问线程,模拟多个访问者同时对一个URL地址进行访问。它的测试目标是基于URL的,因此它既可以来测试apache的负载压力,也可以测试Nginx等服务器的压力。
ab压力测试需要注意哪些?
测试的注意事项:
测试机器与被测试机器要分开,别在同一台机器上测试,否则结果是不准确的
不要对线上的服务器做测试,否则挂了就不好了哦。
观察测试工具ab所在的机器,以及被测试的前端机器的CPU,内存,网络等都不超过最高限度的75%。
下面测试下,两台服务器。
192.168.136.135 作为被测试的WEB服务器
192.168.136.148 作为ab测试的服务器
首先确保ab测试服务器安装ab,使用以下命令yum安装
yum install -y ab //安装
安装完成之后,执行ab命令,返回一些帮助信息,确保安装成功
访问以下被测试的服务器,确保正常
执行下面的命令进行测试
ab -c 100 -n 5000 http://192.168.136.135/phpinfo.php //模拟100个并发数,总共访问5000次
返回的结果
This is ApacheBench, Version 2.3 <$Revision: 655654 $>
Copyright 1996 Adam Twiss, Zeus Technology Ltd, http://www.zeustech.net/ Licensed to The Apache Software Foundation, http://www.apache.org/
Benchmarking 192.168.136.135 (be patient)
Completed 500 requests
Completed 1000 requests
Completed 1500 requests
Completed 2000 requests
Completed 2500 requests
Completed 3000 requests
Completed 3500 requests
Completed 4000 requests
Completed 4500 requests
Completed 5000 requests
Finished 5000 requests

Server Software:        nginx     //被测试的服务器是Nginx
Server Hostname:        192.168.136.135   //Hostname
Server Port:            80                          //端口

Document Path:          /phpinfo.php        //path
Document Length:        96660 bytes     //文档大小

Concurrency Level:      100                   //100个并发
Time taken for tests:   11.860 seconds   //时间花费
Complete requests:      5000                //请求了5000次
Failed requests:        486                   //失败了486次
(Connect: 0, Receive: 0, Length: 486, Exceptions: 0)
Write errors:           0
Total transferred:      484274801 bytes
HTML transferred:       483509342 bytes
Requests per second:    421.60 [#/sec] (mean)   //QPS值,不高
Time per request:       237.194 [ms] (mean)
Time per request:       2.372 [ms] (mean, across all concurrent requests)
Transfer rate:          39876.53 [Kbytes/sec] received

Connection Times (ms)
min  mean[+/-sd] median   max
Connect:        0    1   1.3      1      13
Processing:    45  234  44.2    231     540
Waiting:       23  187  40.7    182     442
Total:         47  235  44.0    232     540

Percentage of the requests served within a certain time (ms)
50%    232     //平均页面的响应时间是232毫秒
66%    238
75%    243
80%    247
90%    280
95%    302
98%    382
99%    442
100%    540 (longest request)  //最长是540毫秒
把并发数改为50测试一下
ab -c 50 -n 5000 http://192.168.136.135/phpinfo.php[/code]..... Connection Times (ms) min mean[+/-sd] median max Connect: 0 1 1.3 1 18 Processing: 52 104 13.2 104 158 Waiting: 36 79 8.1 79 135 Total: 65 105 13.3 104 170 Percentage of the requests served within a certain time (ms) 50% 104 66% 108 75% 111 80% 114 90% 126 95% 131 98% 135 99% 139 100% 170 (longest request) [root@localhost ~]# ab -c 50 -n 5000 http://192.168.136.135/phpinfo.php This is ApacheBench, Version 2.3 <$Revision: 655654 $> Copyright 1996 Adam Twiss, Zeus Technology Ltd, http://www.zeustech.net/ Licensed to The Apache Software Foundation, http://www.apache.org/ Benchmarking 192.168.136.135 (be patient) Completed 500 requests Completed 1000 requests Completed 1500 requests Completed 2000 requests Completed 2500 requests Completed 3000 requests Completed 3500 requests Completed 4000 requests Completed 4500 requests Completed 5000 requests Finished 5000 requests Server Software: nginx Server Hostname: 192.168.136.135 Server Port: 80 Document Path: /phpinfo.php Document Length: 96660 bytes Concurrency Level: 50 Time taken for tests: 10.987 seconds Complete requests: 5000 Failed requests: 478 (Connect: 0, Receive: 0, Length: 478, Exceptions: 0) Write errors: 0 Total transferred: 484064467 bytes HTML transferred: 483299467 bytes Requests per second: 455.07 [#/sec] (mean) //QPS Time per request: 109.874 [ms] (mean) Time per request: 2.197 [ms] (mean, across all concurrent requests) Transfer rate: 43023.80 [Kbytes/sec] received Connection Times (ms) min mean[+/-sd] median max Connect: 0 1 0.9 1 14 Processing: 32 109 14.4 108 192 Waiting: 9 82 10.1 83 158 Total: 32 109 14.3 109 193 Percentage of the requests served within a certain time (ms) 50% 109 66% 112 75% 115 80% 118 90% 129 95% 136 98% 144 99% 152 100% 193 (longest request) //最长193
测试结果其实并不实际很准确,因为测试机和被测试机都在一台机器上。这里值是了解。
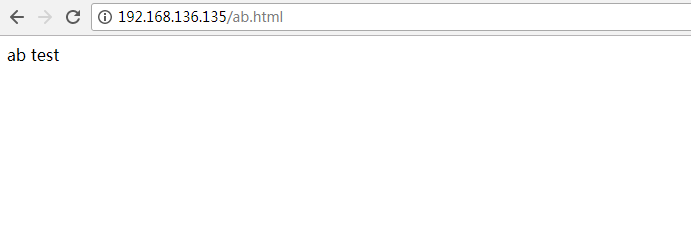
然后再来一个静态的html测试下ab -c 100 -n 5000 http://192.168.136.135/ab.html[/code]
很快完成测试Server Software: nginx Server Hostname: 192.168.136.135 Server Port: 80 Document Path: /ab.html Document Length: 23 bytes Concurrency Level: 100 Time taken for tests: 0.830 seconds Complete requests: 5000 Failed requests: 0 //0次失败 Write errors: 0 Total transferred: 1241916 bytes HTML transferred: 115644 bytes Requests per second: 6024.71 [#/sec] (mean) //QPS达到了6000+ Time per request: 16.598 [ms] (mean) Time per request: 0.166 [ms] (mean, across all concurrent requests) Transfer rate: 1461.36 [Kbytes/sec] received Connection Times (ms) min mean[+/-sd] median max Connect: 1 7 1.4 7 23 Processing: 5 9 1.6 9 24 Waiting: 0 7 1.5 7 11 Total: 10 16 1.8 16 29 Percentage of the requests served within a certain time (ms) 50% 16 //响应也很快 66% 17 75% 17 80% 17 90% 18 95% 19 98% 20 99% 23 100% 29 (longest request)
所以静态和动态的对比,不但要考虑到服务器的性能,还要考虑到程序的优化。

相关文章推荐
- ubuntu中安装apache ab命令进行简单压力测试
- ubuntu中安装apache ab命令进行简单压力测试
- ubuntu中安装apache ab命令进行简单压力测试
- ab压力测试工具简单使用
- Apache自带的压力测试工具ab.exe简单介绍
- PHP测试与优化(1)-- Apache自带的压力测试工具ab(apache bench) - 简单使用
- win8.1上wamp环境中利用apache自带ab压力测试工具使用超简单讲解
- 简单压力测试工具-ab
- ubuntu中安装apache ab命令进行简单压力测试
- apache bench(ab)压力测试模拟POSt请求
- ubuntu中安装apache ab命令进行简单压力测试
- Linux下进行Web服务器压力(并发)测试工具http_load、webbench、ab、Siege、autobench简单使用教程(转)
- ubuntu中安装apache ab命令进行简单压力测试
- 使用ab进行压力测试的简单说明
- ab简单的集群压力测试验证
- ubuntu中安装apache ab命令进行简单压力测试
- ubuntu中安装apache ab命令进行简单压力测试
- 简单好用的服务器压力测试小工具 ab
- ab --- apache自带的压力测试工具 (apache benchmark )
- ab命令测试apache的压力