一个简单的网页系统(二)-地图界面
2017-04-27 14:16
253 查看
一个简单的网页系统(二)
前面的文章简单介绍了网页系统的首页,这次要介绍网页的地图部分。关于前面的leaflet.js已经简单介绍了,在可视化的类别中有介绍。
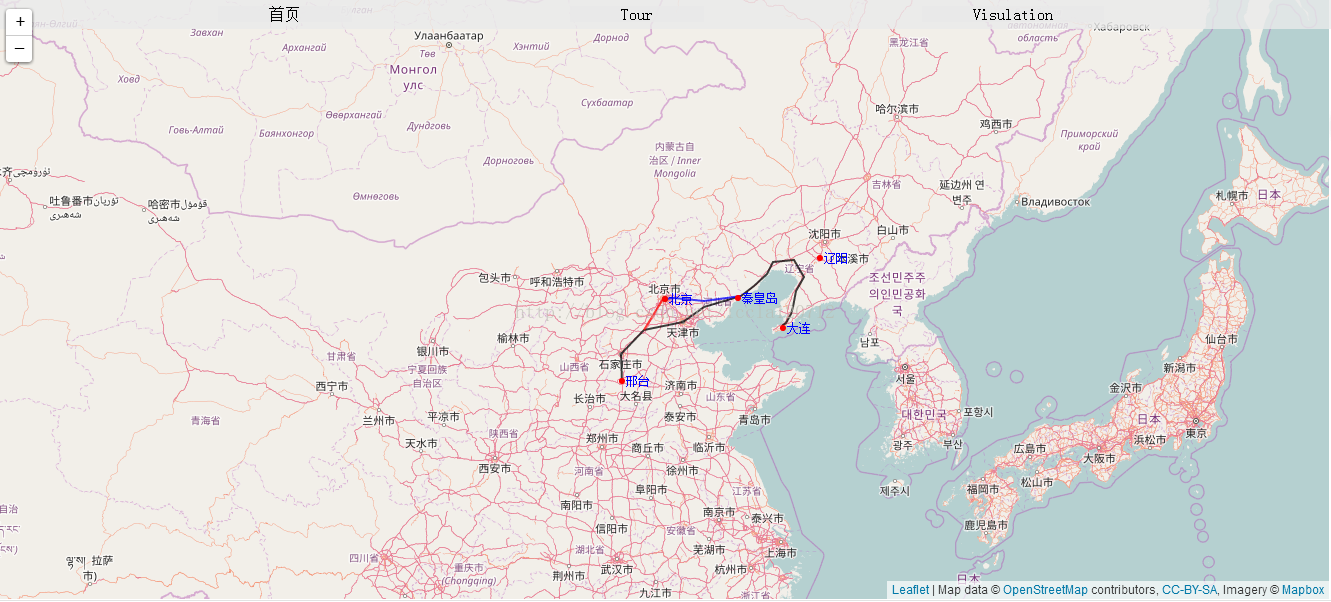
一.效果展示
二.代码分析
1. 使用leaflet.js 库使用OSM地图源,将中心点设置为北京,并设置zoom大小。2. 添加站点:查询要标注地点的经纬度,使用d3加入相应的svg图形并添加文字。
3. 画路径:查询地铁线路经过的火车站点,查询经纬度。使用d3.svg.line 函数完成行程路线。
4. 添加监听事件: 为几个站点添加监听事件,当点击站点时会进行页面的跳转。
三.代码展示
<!DOCTYPE html>
<html>
<head>
<title>Tour China</title>
<meta charset="utf-8">
<script type="text/javascript" src="js/leaflet.js"></script>
<script type="text/javascript" src="js/myfocus-2.0.1.min.js"></script>
<script type="text/javascript" src="js/jquery.js"></script>
<script type="text/javascript" src="js/d3.v3.js"></script>
<link rel="stylesheet" type="text/css" href="css/leaflet.css">
<style type="text/css">
#map{
height:600px;
}
.node{

}
.MyText{
font-size: 8px;
fill: blue;
}
.menu{
position: fixed;
height: 30px;
background-color: rgba(234,234,234,0.8);
width: 100%;
z-index: 60;
}
.menu ul{
list-style: none;
margin-left: 10%;
margin-top: 0;
height: 30px;
line-height: 30px;
}
.menu ul li{
list-style: none;
float: left;
width:22%;
padding: 0 4%;
height:30px;
line-height: 30px;
}
.menu ul li a{
padding: 0 20%;
text-decoration: none;
color: black;
background-color: rgba(234,234,234,0.8);
text-align: center;
}
.menu ul li a:hover,.menu ul li a:active{
color: yellow;
font-size: 25px;
background-color:  rgba(229,229,229,0.8);
}
</style>
</head>
<body>
<div class="menu"><ul>
<li><a href="firstPage.html">首页</a></li><li><a href="index.html">Tour</a></li><li><a href="vis.html">Visulation</a></li>
</ul></div>
<div id="map"></div>
<script type="text/javascript">
var mymap = L.map('map').setView([39.9, 116.3], 5);
L.tileLayer('http://{s}.tile.openstreetmap.org/{z}/{x}/{y}.png',  {
attribution: 'Map data © <a href="http://openstreetmap.org">OpenStreetMap</a> contributors, <a href="http://creativecommons.org/licenses/by-sa/2.0/">CC-BY-SA</a>, Imagery © <a href="http://mapbox.com">Mapbox</a>',
maxZoom: 18
}).addTo(mymap);
// Initialize the SVG layer
mymap._initPathRoot();

// We pick up the SVG from the map object..........
var m_svg = d3.select("#map").select("svg");
var svg = m_svg.append("g");

var posQin=[39.93,119.60];//记录经纬度
var posXing=[37.0755,114.50];//邢台
var posDaLian=[38.9227,121.616792];
var posBei=[39.91737,116.4002];
var posLiaoYang=[41.275,123.239];
var data=[posQin,posXing,posDaLian,posBei,posLiaoYang];
//邢台 石家庄 保定 天津 唐山 山海关
//绥中 葫芦岛 锦州 盘锦 大石桥 熊岳城 瓦房店 普兰店
//金州 大连北站 XX XX 大连
var dataLine=[[114.50,37.0755],[114.492,38.017],[115.4895,38.868],[117.223,39.143],[118.123,39.63],[119.7727,40.007],
[120.332,40.354],[120.8738,40.76],[121.1439,41.1306],[122.069,41.2031],[122.51439,40.6523],[122.1514,40.1876],[122.0147,39.6317],[121.9658,39.4071],
[121.7333,39.094],[121.6140,39.0225],[121.5722,38.9638],[121.5969,38.9268],[121.6393,38.928]];//T370

//北京 燕郊 唐山北 XXX
//大石桥 -大连(与第一条线合并)
var dataLine2=[[116.4337,39.9098],[116.8139,39.9475],[118.1333,39.8283],[119.7727,40.007]];//k681

//保定-北京西
var dataLine3=[[115.4895,38.868],[116.32784,39.9005]];
var data1=[1];
var data2=['秦皇岛','邢台','大连','北京','辽阳'];

var d3Line=d3.svg.line()
.x(function (d) {
var latlon=new L.LatLng(d[1], d[0]);

return mymap.latLngToLayerPoint(latlon).x;
})
.y(function (d) {
var latlon=new L.LatLng(d[1], d[0]);

return mymap.latLngToLayerPoint(latlon).y;

})
.interpolate("linear");

//Add three paths to the map
svg.append('path')
.attr('id','path')
.attr('class',"pa")
.attr('d',d3Line(dataLine))
.style("stroke-width", 2)
.style("stroke", '#000000')
.style("fill", "none")
.style('stroke-opacity', 0.75);

svg.append('path')
.attr('id','path2')
.attr('class',"pa")
.attr('d',d3Line(dataLine2))
.style("stroke-width", 2)
.style("stroke", 'blue')
.style("fill", "none")
.style('stroke-opacity', 0.75);

svg.append('path')
.attr('id','path3')
.attr('class',"pa")
.attr('d',d3Line(dataLine3))
.style("stroke-width", 2)
.style("stroke", 'red')
.style("fill", "none")
.style('stroke-opacity', 0.75);

svg.selectAll('.node')//秦皇岛
.data(data)
.enter()
.append('circle')
.attr("id",function(d,i){
i++;
return 'pos'+i;
})
.attr("class","node")
.attr('fill','#ff0000')
.attr('r',3)
.attr("transform", function(d,i){
var latlon=new L.LatLng(d[0], d[1]);
// console.log(latlon);
return "translate(" + mymap.latLngToLayerPoint(latlon).x + "," + mymap.latLngToLayerPoint(latlon).y + ")";
});

var texts = svg.selectAll(".MyText")//添加文字
.data(data2)
.enter()
.append("text")
.attr("class","MyText")
.attr("id",function(d,i){
i++;
return 'text'+i;
})
.attr("color","blue")
.attr("transform",function(d,i){
var latlon=new L.LatLng(data[i][0], data[i][1]);
// console.log(latlon);
return "translate(" + mymap.latLngToLayerPoint(latlon).x + "," + mymap.latLngToLayerPoint(latlon).y + ")";
})

aeb9
.attr("dx",function(){
return 4;//相对x 轴的偏移
})
.attr("dy",function(d){
return 4;//相对y 轴的偏移
})
.text(function(d){
return d;
});

mymap.on("zoomstart",function(){
svg.selectAll('.pa')
.style('display','none');
});

mymap.on("zoomend",function(){
svg.selectAll('.pa')
.style('display','inherit');

svg.selectAll('.MyText')
.attr("transform",function(d,i){
var latlon=new L.LatLng(data[i][0], data[i][1]);
// console.log(latlon);
return "translate(" + mymap.latLngToLayerPoint(latlon).x + "," + mymap.latLngToLayerPoint(latlon).y + ")";
})
.attr("dx",function(){
return 4;//相对x 轴的偏移
})
.attr("dy",function(d){
return 4;//相对y 轴的偏移
})
.text(function(d){
return d;
});

svg.selectAll('.node')
.attr("transform", function(d,i){
var latlon=new L.LatLng(d[0], d[1]);
return "translate(" + mymap.latLngToLayerPoint(latlon).x + "," + mymap.latLngToLayerPoint(latlon).y + ")";
});
svg.select('#path')
.attr('d',d3Line(dataLine))
.style("stroke-width", 2)
.style("stroke", '#000000')
.style("fill", "none")
.style('stroke-opacity', 0.75);

svg.select('#path2')
.attr('d',d3Line(dataLine2))
.style("stroke-width", 2)
.style("stroke", 'blue')
.style("fill", "none")
.style('stroke-opacity', 0.75);

svg.select('#path3')
.attr('d',d3Line(dataLine3))
.style("stroke-width", 2)
.style("stroke", 'red')
.style("fill", "none")
.style('stroke-opacity', 0.75);

});
$('#pos1').click(function(){
$(window).attr('location','china-tour/qinH.html');
});
$('#pos2').click(function(){
$(window).attr('location','china-tour/xingTai.html');
});
$('#pos3').click(function(){
$(window).attr('location','china-tour/daLian.html');
});
$('#pos4').click(function(){
$(window).attr('location','china-tour/beiJing.html');
});
$('#pos5').click(function(){
$(window).attr('location','china-tour/liaoYang.html');
});
$(window).unload(function(){//释放内存,提高性能
svg=null;
mymap=null;
});
</script>
</body>
</html>
四.后期展示
之后会有最后一篇关于此网页系统的文章,并附上自己gitHub源码位置。
相关文章推荐
- 用Qt写软件系列三:一个简单的系统工具之界面美化
- 一个简单的网页系统Tour(终结) 和效果展示图
- 用C#构建一个简单的采集系统之一-主界面设计
- 用Qt写软件系列三:一个简单的系统工具之界面美化
- 用Qt写软件系列三:一个简单的系统工具之界面美化
- python实现一个简单的图书馆借阅系统(不涉及数据库和界面设计)
- CSS+DIV 设计一个简单的个人网页界面
- 一个简单的网页系统(-) 首页
- .Net/C#: 一个将在线简体中文网页转为繁体中文页简单方法 (尚不完善 IHttpHandler Proxy / Response.Filter)
- 一个简单的网上报名系统【1】
- 一个简单的自动发送邮件系统(三)
- 一个简单的自动发送邮件系统(一)
- 用ASP.NET将网页错误信息写入系统日志----简单
- 一个简单的分布式系统
- 由神秘到简单 教你在网页中添加微软地图
- 利用C#编写一个简单的抓网页应用程序
- 一个Web系统的界面设计和开发.1
- 利用C#编写一个简单的抓网页应用程序
- .Net/C#: 一个将在线简体中文网页转为繁体中文页简单方法
- .Net/C#: 一个将在线简体中文网页转为繁体中文页简单方法 (尚不完善 IHttpHandler Proxy / Response.Filter)