Matlab绘图添加直角坐标轴
2017-04-12 23:44
225 查看
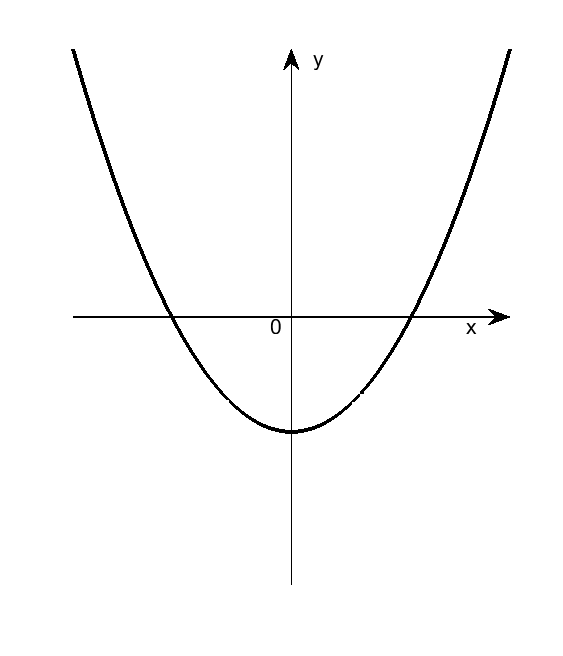
绘制y=x^2,并添加直角坐标轴。
clear;clc;close all
%% 绘制方程
x = -10:0.01:10;
figure;
y = x.^2-30;
plot(x,y,'k','linewidth',2)
axis off
set(gcf,'Position',[100 100 360 420]);
w1 = min(y);
w2 = max(y);
%% 绘制坐标轴
xlim = max(abs(x));
ylim = max(abs([w1 w2]));
axis(gca,[-xlim xlim -ylim ylim]);
xx = get(gca,'xtick');
yy = get(gca,'ytick');
dx = mean(diff(yy))/5;
dy = mean(diff(xx))/5;
axis(gca,[-xlim xlim -ylim ylim]);
set(gca,'units','normalized');
pos1 = get(gca,'position');
s1 = [pos1(1) pos1(2)+pos1(4)/2];
s2 = [pos1(1)+pos1(3) pos1(2)+pos1(4)/2];
s3 = [pos1(1)+pos1(3)/2 pos1(2)];
s4 = [pos1(1)+pos1(3)/2 pos1(2)+pos1(4)];
annotation('arrow',[s1(1) s2(1)],[s1(2) s2(2)])
annotation('arrow',[s3(1) s4(1)],[s3(2) s4(2)])
% 显示坐标轴标注
text(max(x)-2,-2,'x') % 自己动手调整
text(1,max(y)-2,'y') % 自己动手调整
text(-1,-2,'0') % 自己动手调整
%% 保存图片
saveas(gcf,'pic.png')

相关文章推荐
- 如何在Matlab绘图中添加x坐标文字标签
- 向已知信号添加噪声——matlab仿真
- Matlab与C++混合编程,添加OpenCV库
- MatLab建模学习笔记1——二维绘图
- matlab学习基本绘图例子
- MATLAB绘图
- Matlab二维曲线绘图
- MATLAB绘图
- MATLAB模糊逻辑系统根据模糊系统模型绘图
- Matlab绘图程序局部放大
- ROC曲线详解及matlab绘图实例
- 基于MATLAB GUI界面的MCU串口实时绘图设计
- Android官方开发文档Training系列课程中文版:OpenGL绘图之添加动态效果
- 改小matlab的绘图大小、字号、线宽
- Matlab 2014a添加桌面快捷方式(ubuntu14.04 kylin)
- 【原】在Matplotlib绘图中添加Latex风格公式
- MATLAB 绘图之 设置绘图属性(持续更新中)
- Matlab绘图颜色
- Matlab中给figure添加图例(legend),标题(title)和颜色(color)
- MATLAB读取mat数据并绘图