从np.random.normal()到正态分布的拟合
2017-04-10 19:40
495 查看
先看伟大的高斯分布(Gaussian Distribution)的概率密度函数(probability density function):
f(x)=12π−−√σexp(−(x−μ)22σ2)
对应于numpy中:
1
参数的意义为:
2
3
4
5
6
1
2
3
4
5
6
我们更经常会用到的
2
3
1
2
3
也可使用scipy库中的相关api(这里的类与函数更符合数理统计中的直觉):
2
3
1
2
3
2
3
4
5
6
1
2
3
4
5
6
我们看使用
2
3
4
5
6
1
2
3
4
5
6
或者:
2
1
2
f(x)=12π−−√σexp(−(x−μ)22σ2)
对应于numpy中:
numpy.random.normal(loc=0.0, scale=1.0, size=None)1
1
参数的意义为:
loc:float
此概率分布的均值(对应着整个分布的中心centre)
scale:float
此概率分布的标准差(对应于分布的宽度,scale越大越矮胖,scale越小,越瘦高)
size:int or tuple of ints
输出的shape,默认为None,只输出一个值
1
2
3
4
5
6
1
2
3
4
5
6
我们更经常会用到的
np.random.randn(size)所谓标准正态分布(μ=0,σ=1),对应于
np.random.normal(loc=0,
scale=1, size)
。
采样(sampling)
# 从某一分布(由均值和标准差标识)中获得样本
mu, sigma = 0, .1
s = np.random.normal(loc=mu, scale=sigma, size=1000)
1
2
3
1
2
3
也可使用scipy库中的相关api(这里的类与函数更符合数理统计中的直觉):
import scipy.stats as st
mu, sigma = 0, .1
s = st.norm(mu, sigma).rvs(1000)
1
2
3
1
2
3
校验均值和方差:
>>> abs(mu < np.mean(s)) < .01
True
>>> abs(sigma-np.std(s, ddof=1)) < .01
True
# ddof,delta degrees of freedom,表示自由度
# 一般取1,表示无偏估计,
1
2
3
4
5
6
1
2
3
4
5
6
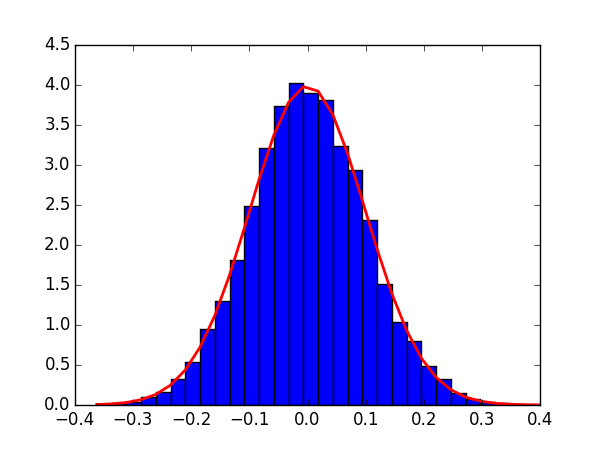
拟合
我们看使用matplotlib.pyplot便捷而强大的语法如何进行高斯分布的拟合:
import matplotlib.pyplot as plt
count, bins, _ = plt.hist(s, 30, normed=True)
# normed是进行拟合的关键
# count统计某一bin出现的次数,在Normed为True时,可能其值会略有不同
plt.plot(bins, 1./(np.sqrt(2*np.pi)*sigma)*np.exp(-(bins-mu)**2/(2*sigma**2), lw=2, c='r')
plt.show()
1
2
3
4
5
6
1
2
3
4
5
6
或者:
s_fit = np.linspace(s.min(), s.max())
plt.plot(s_fit, st.norm(mu, sigma).pdf(s_fit), lw=2, c='r')
1
2
1
2

相关文章推荐
- 从np.random.normal()到正态分布的拟合
- 从np.random.normal()到正态分布的拟合
- 从np.random.normal()到正态分布的拟合
- np.random.normal()正态分布
- python中的np.random.normal
- coding小记:np.random.randn与tf.random_normal
- python中的np.random.normal
- #np.random.normal,产生制定分布的数集(默认是标准正态分布)
- np.random.choice 参数replace
- numpy 随机数种类np.random.RandomState、np.random.rand、np.random.random、np.random_sample
- np.random.seed()
- np.random.randint产生一个范围内的数据
- np.random.choice的用法
- [置顶] NP难问题与过拟合
- tf.random_normal
- C#利用Random得随机数求均值、方差、正态分布的方法
- tf.truncated_normal与tf.random_normal
- matlab 拟合正态分布
- np.random.seed(0)的作用:作用:使得随机数据可预测。
- tf.truncated_normal与tf.random_normal