echart 图表动态的显示拐点为空心
2017-01-13 00:00
267 查看
有时候我们需要在月份没结束时,此处的数据拐点样式与之前结束月份有区别,如下
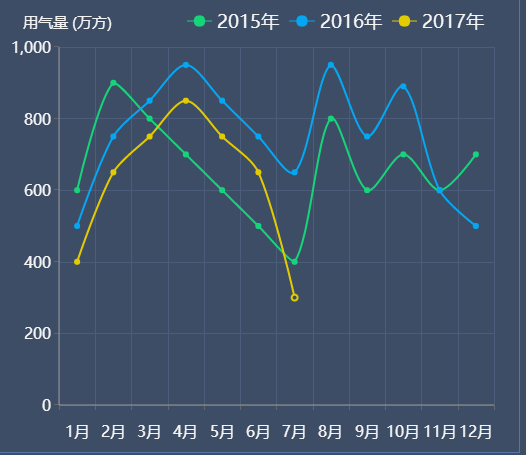
如上图假如七月份还没有结束,最后一个拐点的样式是空心的
思路是需要先判断空数据的位置,然后在位置之前的数据设置样式,
如上图假如七月份还没有结束,最后一个拐点的样式是空心的
思路是需要先判断空数据的位置,然后在位置之前的数据设置样式,
var specialVal = {value:300, itemStyle: {normal:{color: "#3d4d66",borderColor:"#e3cb02",borderWidth:2,borderType: 'solid'}}};
var option7 = {
color: ['#16d479','#05a7f2','#e3cb02'],
/*title : {
text : '行业1',
x : 'center',
y : 'top',
textStyle : {
fontSize : 25,
}
}, */

grid: {
top: 40,
bottom: 20,
left:10,
right:10,
containLabel: true,

},
tooltip : {
trigger: 'axis',
axisPointer : {            // 坐标轴指示器,坐标轴触发有效
type : 'shadow'        // 默认为直线,可选为:'line' | 'shadow'
},
formatter: function(params) {
return params[0].name + '<br/>'
+ params[0].seriesName + ' : ' + params[0].value+' 万方'+ '<br/>'
+ params[1].seriesName + ' : ' + params[1].value+' 万方'+ '<br/>'
+ params[2].seriesName + ' : ' + params[2].value+' 万方'+ '<br/>'

}
},
legend: {
data:['2015年','2016年','2017年'],
right:5,
top:0
},
xAxis: {

type: 'category',
axisLabel:{interval:0},

data: ["1月","2月","3月","4月","5月","6月","7月","8月","9月","10月","11月","12月"],
},

yAxis: {
name:'    用气量 (万方)',
nameTextStyle:{fontSize:15},
splitLine: {
show: true,
interval: 'auto',
lineStyle: {
color: ['#4b5d7a'],
type: 'solid'
},
},
},
series: [
{
name: '2015年',
type: 'line',
smooth:true,
data: [600,900,800,700,600,500,400,800,600,700,600,700],

},
{
name: '2016年',
type: 'line',
smooth:true,
data: [500,750,850,950,850,750,650,950,750,890,600,500],
},
{
name: '2017年',
type: 'line',
smooth:true,
data: [400,650,750,850,750,650,550,null,null,null,null,null],
},
/*
{
name: '最近月用量',
type: 'line',
smooth:true,
data: [null,null,null,null,null,null,null,null,null,null,null,900],
},*/

]
};
for(i=0;i<11;i++){
if(option7.series[2].data[i]==null){
specialVal.value = option7.series[2].data[i-1];
option7.series[2].data[i-1] = specialVal;
break;
}
}

var myChart = echarts.init(document.getElementById('barchart2'),theme);
myChart.setOption(option7);

相关文章推荐
- 求助水晶报表动态饼图显示、求助进行数据查询和把查询结果用图表比较出来
- 动态地显示统计图表--横式
- [js动态报表][兼容IE6+/火狐/360/谷歌/等各大浏览器][可手动设置间隔时间读取数据/并且显示在图表上]
- echart 图表显示技术
- HighCharts、EChart图表X轴纵向显示
- 让动态生成的图表以.png文件显示
- 百度echart在ie下图表不显示的问题
- Highcharts AJAX JSON JQuery 实现动态数据交互显示图表 柱形图
- Highcharts AJAX JSON JQuery 实现动态数据交互显示图表 柱形图
- 百度echart在ie下图表不显示的问题
- 动态地显示统计图表--竖式
- 使用Visifire+ArcGIS API for Silverlight实现Graphic信息的动态图表显示
- 使用Visifire+ArcGIS API for Silverlight实现Graphic信息的动态图表显示
- 解决echart在IE中使用时,在div中添加postion后图表不显示问题
- Extjs4 动态生成图表chart(从后台传数据动态显示)
- 基于ASP和COM组件的动态图表显示
- Android通过iChartJs实现动态图表、报表的显示Demo
- 使用Visifire+ArcGIS API for Silverlight实现Graphic信息的动态图表显示
- Highcharts AJAX JSON JQuery 实现动态数据交互显示图表 柱形图
- 百度echart在ie下图表不显示的问题