ELK之topbeat部署
2016-12-09 15:02
288 查看
topbeat定期收集系统信息如每个进程信息、负载、内存、磁盘等等,然后将数据发送到elasticsearch进行索引,最后通过kibana进行展示。
下面是具体的安装及配置步骤:
1、安装topbeat
2、配置topbeat
3、配置elasticsearch模板
4、启动topbeat
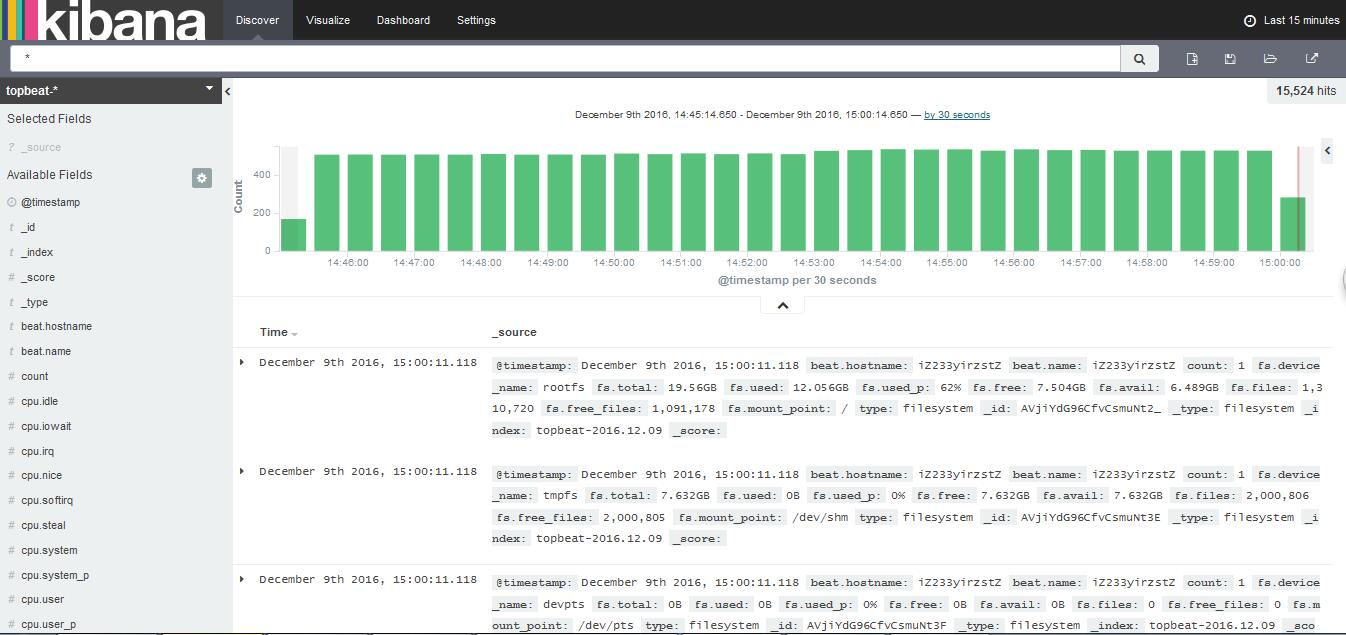
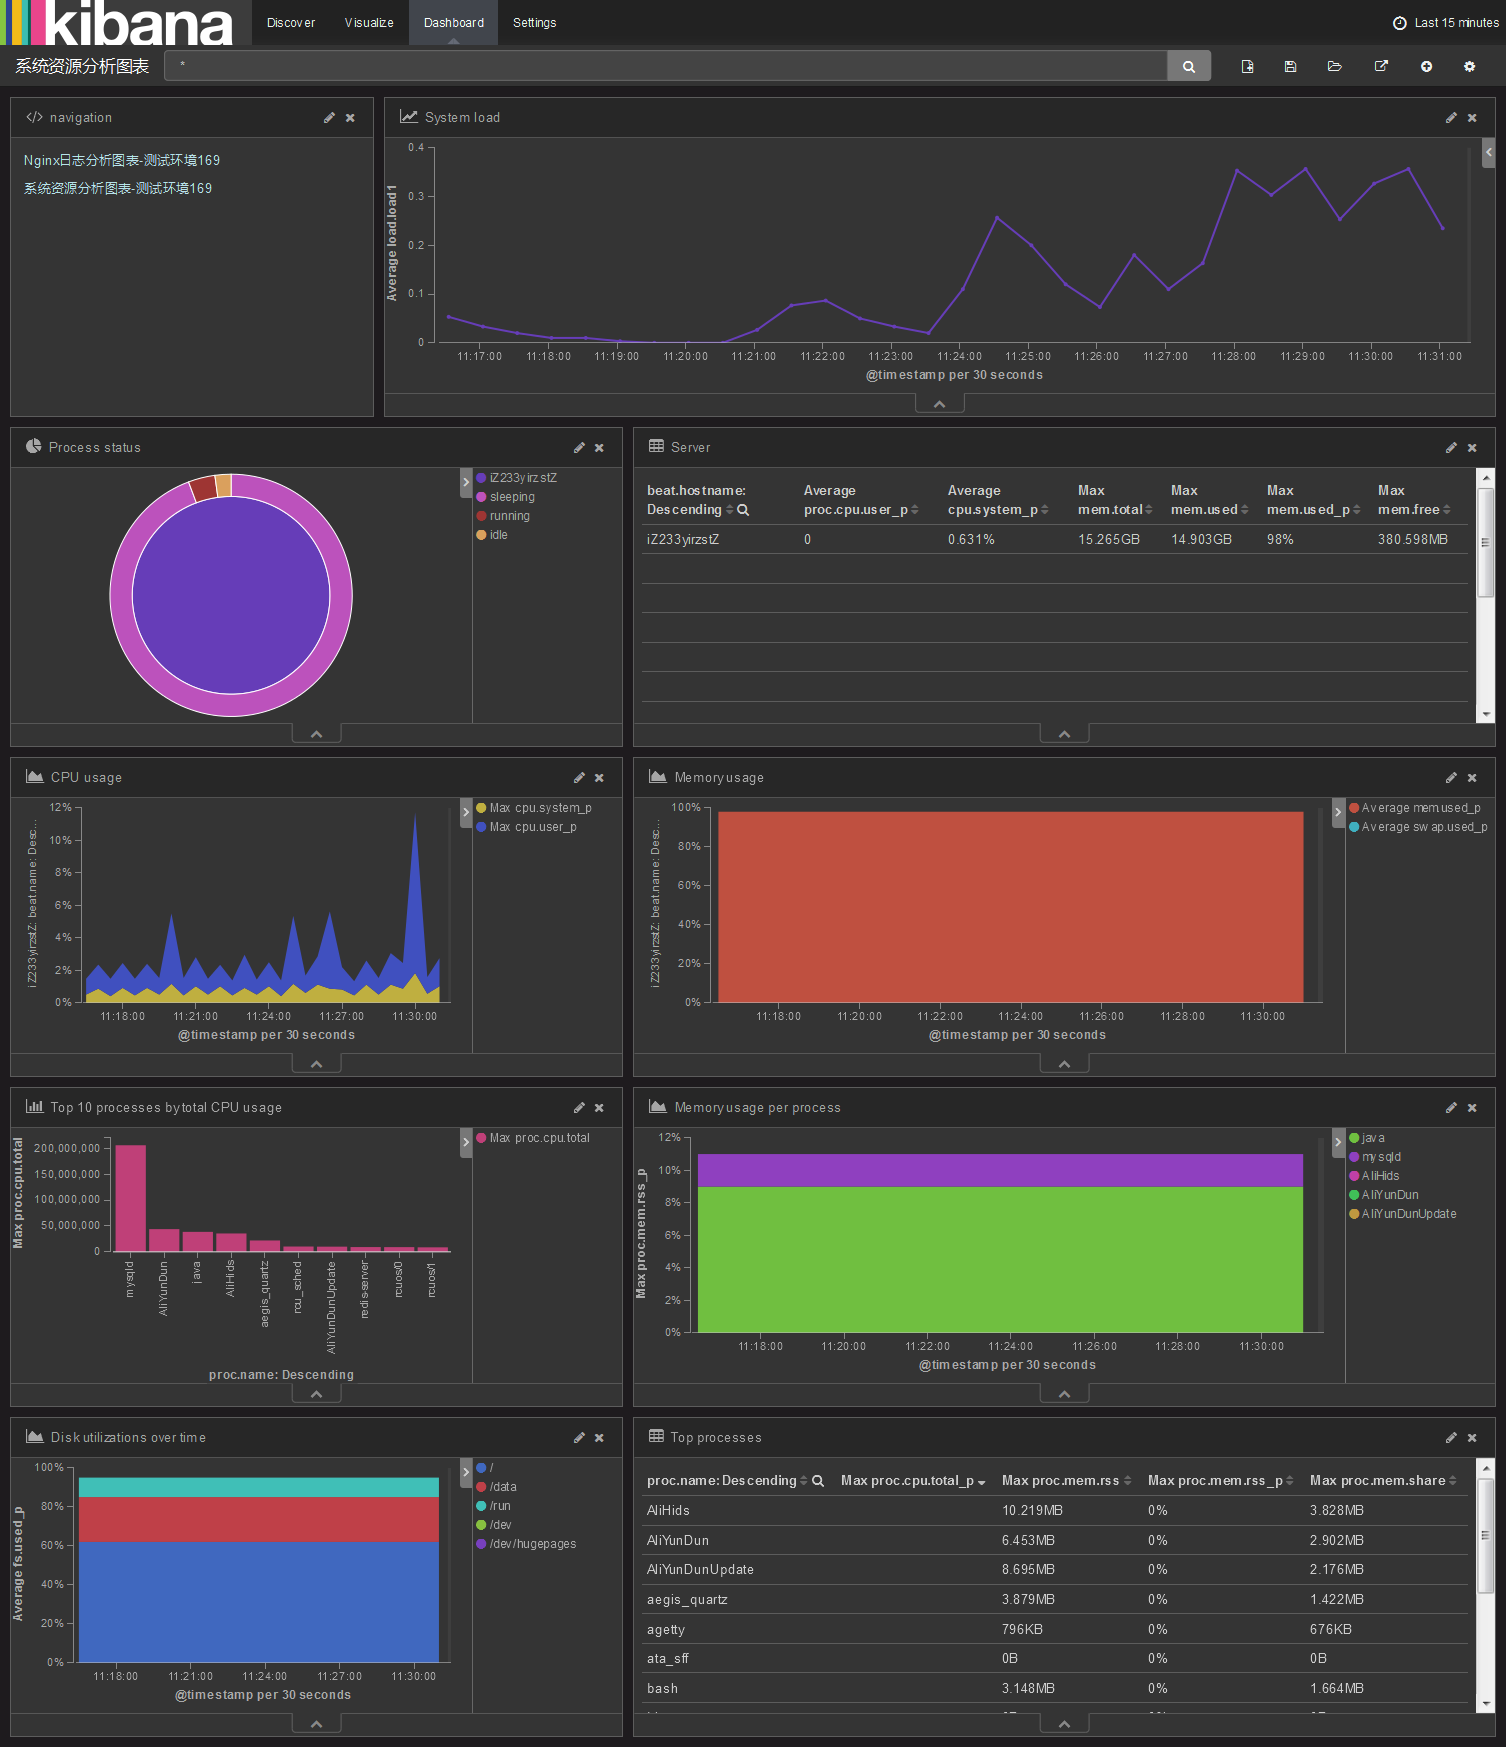
最后看一下在Kibana中的数据及图表展示:
下面是具体的安装及配置步骤:
1、安装topbeat
$ tar zxf topbeat-1.3.1-x86_64.tar.gz
$ mv topbeat-1.3.1 topbeat
2、配置topbeat
$ vim topbeat/topbeat.yml #修改如下内容
input:
# In seconds, defines how often to read server statistics
period: 10

# Regular expression to match the processes that are monitored
# By default, all the processes are monitored
procs: [".*"]

# Statistics to collect (all enabled by default)
stats:
# per system statistics, by default is true
system: true

# per process statistics, by default is true
process: true

# file system information, by default is true
filesystem: true

# cpu usage per core, by default is false
cpu_per_core: true

output:

### Elasticsearch as output
elasticsearch:
hosts: ["ip:9200"]
3、配置elasticsearch模板
$ curl -XPUT 'http://ip:9200/_template/topbeat' -d@/data/elk/topbeat/topbeat.template.json
4、启动topbeat
$ cd topbeat/
$ nohup ./topbeat &
最后看一下在Kibana中的数据及图表展示:

相关文章推荐
- ELK Packetbeat 部署指南
- elk的安装部署三(kibana的安装及使用filebeat收集日志)
- filebeat+kafka+ELK5.4安装与部署
- 【centos】安装ELK之插件topbeat
- python fabric部署elk的filebeat日志收集客户端
- 【ELK】topbeat对服务器CPU,memory,硬盘等参数监控
- ELK实时日志分析平台(elk+kafka+metricbeat)-elasticsearch部署(五)
- ELK Packetbeat 部署指南(15th)
- ELK Packetbeat 部署指南(15th)
- Kubernetes部署ELK并使用Filebeat收集容器日志
- ELK实时日志分析平台(elk+kafka+metricbeat)-kibana部署(六)
- 如何在Ubuntu 14.04上利用Topbeat与ELK收集基础设施指标
- ELK+filebeat日志分析系统部署文档
- ELK+filebeat日志分析系统部署文档
- filebeat+kafka+ELK5.4安装与部署
- ELK日志管理之——logstash部署
- ELK日志分析系统部署
- ELK学习10_ELK系列--实时日志分析系统ELK 部署与运行中的问题汇总
- elk实时日志分析平台部署搭建详细实现过程