Python 模块--matplotlib安装和学习
2016-11-17 10:58
651 查看
matplotlib安装和学习 当安装完成后,利用在python的shell环境了,利用import matplotlib检测一下是否成功安装。
 若在检测时,发现有错误,可能是缺少对应的模块,或者是安装的matplotlib的版本不够新,重新下载对应的matplotlib版本并重新安装。
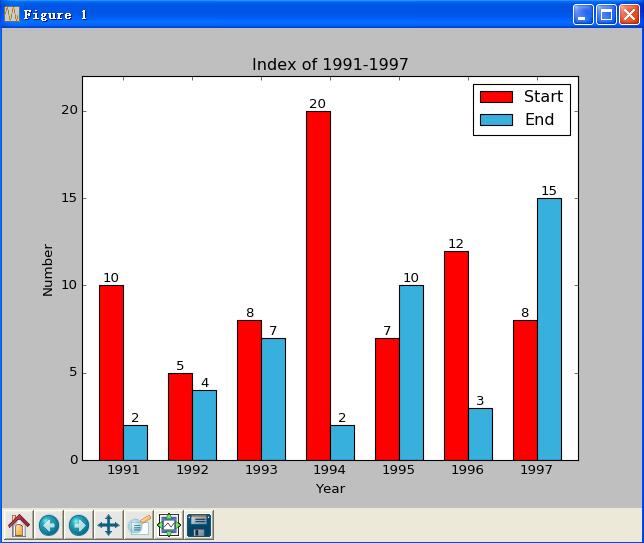
安装:
根据python版本和操作系统版本下载对应的matplotlib。下载地址:https://sourceforge.net/projects/matplotlib/files/matplotlib/我的电脑是win7(32bit),python是2.7,下载对应的matplotlib-1.5.1里面的matplotlib-1.5.1-cp27-none-win32.whl。利用python的pip包管理工具,直接在cmd窗口中cd到刚才下载文件的目录下,并输入以下命令:pipinstall matplotlib-1.5.1-cp27-none-win32.whl,直到安装完毕。当安装完成后,利用在python的shell环境了,利用import matplotlib检测一下是否成功安装。若在检测时,发现有错误,可能是缺少对应的模块,或者是安装的matplotlib的版本不够新,重新下载对应的matplotlib版本并重新安装。学习:
学习的例子:http://matplotlib.org/examples/index.html画图的命令:http://matplotlib.org/api/pyplot_summary.html选择一个barchart例子,修改并加上一些注释的代码如下:# -*- coding:utf-8 -*-import numpyimport matplotlib.pyplot as pltdef draw():starts = (10,5,8,20,7,12,8)ends = (2,4,7,2,10,3,15)N = len(starts)ID_Name = ('1991','1992','1993','1994','1995','1996','1997')ind = numpy.arange(N)#设置batchart的x位置print indwidth = 0.35fig,ax = plt.subplots()rects1 = ax.bar(ind+width,starts,width,color = 'r')#rects1 represents starts data of each itemrects2 = ax.bar(ind+width+width,ends,width,color = '#38B0DE')#rects1 represents ends data of each itemax.set_ylabel('Number')ax.set_title('Index of 1991-1997')ax.set_xlabel('Year')ax.set_xticks(ind+width+width)#x的标签位置ax.set_xticklabels(ID_Name)#为x设置标签ax.legend((rects1[0],rects2[0]),('Start','End'))#加入图注ymin, ymax = plt.ylim()#获取当前坐标系的纵坐标的极限坐标xmin, xmax = plt.xlim()#获取当前坐标系的横坐标的极限坐标plt.ylim(ymin,ymax+2)#设置并调整当前坐标系的纵坐标的极限坐标plt.xlim(xmin+0.1,xmax-0.7)#设置并调整当前坐标系的横坐标的极限坐标# 为每个barchart内的bar标注具体的信息for rect in rects1:height = rect.get_height()ax.text(rect.get_x() + rect.get_width()/2., 1.0*height,'%d' % int(height),ha='center', va='bottom')for rect in rects2:height = rect.get_height()ax.text(rect.get_x() + rect.get_width()/2., 1.0*height,'%d' % int(height),ha='center', va='bottom')handle = plt.gcf()#获取当前窗口get current figurehandle.savefig('travelplot.png',format = 'png',dpi=100)#用png格式保存图片plt.show()#显示图片plt.close()#如果不关闭,后面的程序:print语句不会执行print 'This sentence maybe does not appear when current figure does not close properly'if __name__ == "__main__":draw()最终的效果图:

相关文章推荐
- python学习笔记(1)之如何在python3.x下安装PIL、numpy以及matplotlib
- Windows64位下各版本Python安装numpy,SciPy,matplotlib,Ipython模块
- python 安装matplotlib 模块
- Ubuntu环境下完美安装python模块numpy,scipy,matplotlib
- ImportError: No module named matplotlib.pyplot安装模块python
- 【利用python进行数据分析-学习记录】python-matplotlib中Basemap插件的安装
- windows下python安装Numpy、Scipy、matplotlib模块
- ImportError: No module named matplotlib.pyplot安装模块python
- 为python安装numpy和matplotlib等模块的方法
- Python模块简介及安装 [numpy,pandas,matplotlib,scipy,statsmodels,Gensim,sklearn,keras]
- 【编程语言】Python 使用包管理工具pip安装模块numpy、scipy、matplotlib以及scikit-learn CentOS 7
- Windows系统中安装Python模块pip numpy matplotlib
- 64位32位windows7安装python34和python27,numpy,scipy,matplotlib,scikit-learn等第三方模块
- Python学习之matplotlib的安装
- python中的Numpy、MatPlotLib和SciPy模块的安装
- Python之matplotlib和pandas 模块安装
- 机器学习实战python环境搭建以及numpy和matplotlib安装遇到的各种问题(一)
- Python:如何卸载已经安装的模块(如matplotlib)
- 雾山的Python学习笔记---Matplotlib的安装
- liunx 环境下 python模块numpy,scipy,matplotlib 安装