matlab绘图--线性规划图解法示意
2016-10-06 19:53
381 查看
matlab绘图--线性规划图解法示意
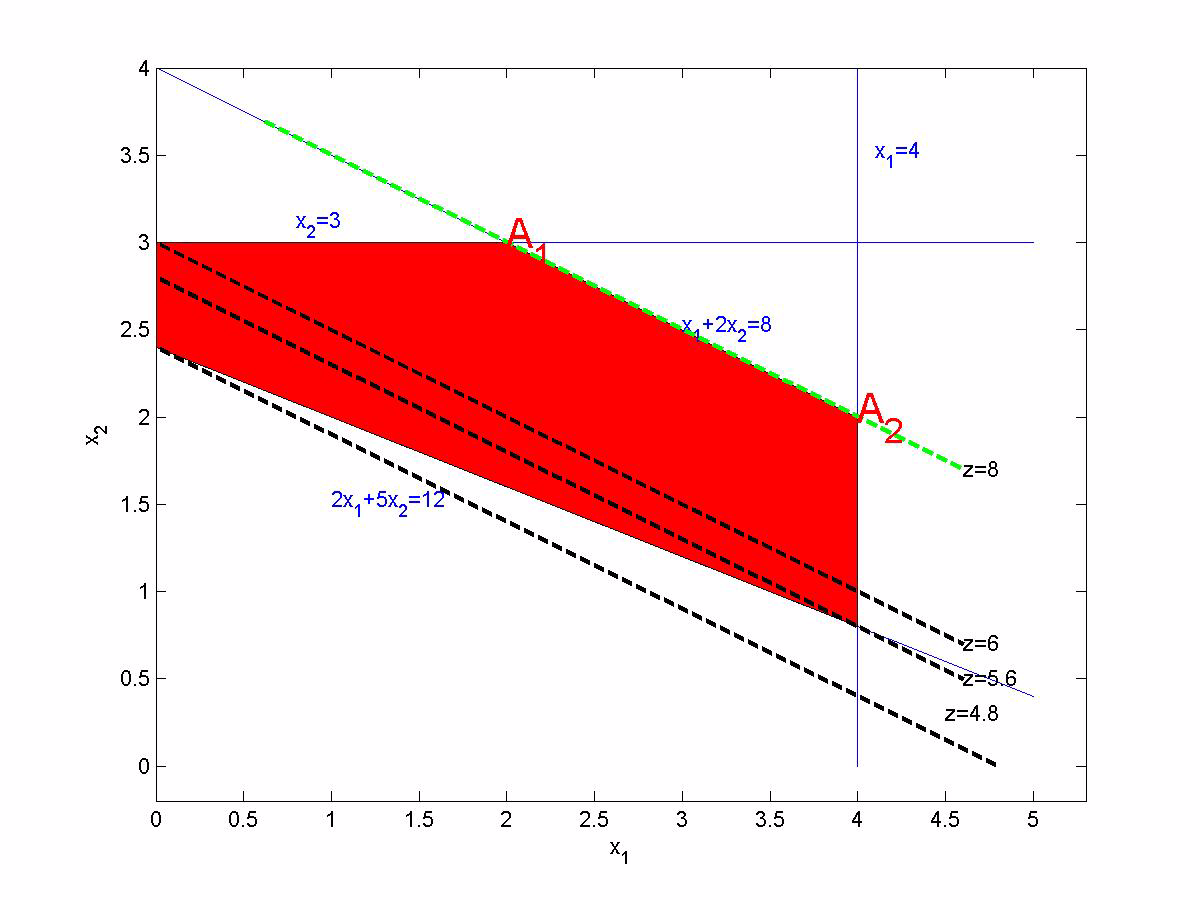
图解法matlab绘图区域填充线性规划问题:

matlab绘图
- L1=[4,0;4,4];
- plot(L1(:,1),L1(:,2));hold on
- text(4.1,3.5,'x_1=4','color','b');
- L2=[0 3;5 3];
- plot(L2(:,1),L2(:,2));hold on
- text(0.8,3.1,'x_2=3','color','b');
- L3=[0 2.4;5 0.4];
- plot(L3(:,1),L3(:,2));hold on
- text(1,1.5,'2x_1+5x_2=12','color','b')
- L4=[0,4;4,2];
- plot(L4(:,1),L4(:,2));
- text(3,2.5,'x_1+2x_2=8','color','b')
- x=[0 0 2 4 4]';
- y=[2.4 3,3,2,0.8]';
- fill(x,y,'r');
- xlabel('x_1')
- ylabel('x_2')
- axis([0 5.3 -0.2 4])
- z0=[0,2.4;4.8,0];
- plot(z0(:,1),z0(:,2),'k--','LineWidth',2);
- text(4.5,0.3,'z=4.8')
- z1=[0,2.8;4.6,0.5];
- plot(z1(:,1),z1(:,2),'k--','Linewidth',2);
- text(4.6,0.5,'z=5.6')
- z2=[0,3;4.6,0.7];
- plot(z2(:,1),z2(:,2),'k--','Linewidth',2);
- text(4.6,0.7,'z=6')
- z3=[0.6,3.7;4.6,1.7];
- plot(z3(:,1),z3(:,2),'g--','Linewidth',2);
- text(4.6,1.7,'z=8')
- text(4,2,'A_2','color','r','fontsize',20);
- text(2,3,'A_1','color','r','fontsize',20);
结果图

相关文章推荐
- 线性规划问题之MATLAB实现
- matlab线性规划
- Matlab线性规划函数linprog…
- matlab求解线性规划问题
- 利用Matlab求解线性规划问题
- 线性规划(matlab实现)
- [数学建模]线性规划与matlab解法
- Matlab 线性规划问题(来自CSDN by WC 1.7.2016 用于个人学习)
- 几类可以神奇转化为线性规划的问题matlab求解
- MATLAB规划问题——线性规划和非线性规划(from CSDN echo_hello)
- 线性规划(Matlab)丨线性规划问题与投资的收益和风险
- 线性规划问题的matlab求解
- Matlab数模笔记(10)--线性规划、非线性规划 与 0/1规划 模型
- 线性规划问题的matlab求解
- 差分约束系统的图解法; 形式很特殊的一种线性规划问题; 可以转化为求带负边最短路问题;
- 用MATLAB优化工具箱解线性规划
- matlab学习-线性规划
- matlab 线性规划函数-linprog
- Matlab线性规划函数linprog的使用
- 利用线性规划函数linprog解线性系统(Matlab)