Guided Project: Predicting board game reviews
2016-09-27 00:00
260 查看
1: Board Game Reviews
Board games have been making a comeback lately, and deeper, more strategic boardgames, likeSettlers of Catan have become hugely popular. A popular site where these types of board games are discussed and reviewed is BoardGameGeek.In this project, you'll be working with a dataset that contains
80000board games and their associated review scores. The data was scraped from BoardGameGeek and compiled into CSV format by Sean Beck. The dataset is stored in
board_games.csv, and can be downloaded here. If you need help at any point, you can consult our solution notebook here.
Here's a preview of the first 5 rows and columns:

Each row represents a single board game, and has descriptive statistics about the board game, as well as review information. Here are some of the interesting columns:
name-- name of the board game.
playingtime-- the playing time (given by the manufacturer).
minplaytime-- the minimum playing time (given by the manufacturer).
maxplaytime-- the maximum playing time (given by the manufacturer).
minage-- the minimum recommended age to play.
users_rated-- the number of users who rated the game.
average_rating-- the average rating given to the game by users. (0-10)
total_weights-- Number of weights given by users.
Weightis a subjective measure that is made up by BoardGameGeek. It's how "deep" or involved a game is. Here's a full explanation.
average_weight-- the average of all the subjective weights (0-5).
One interesting machine learning task might be to predict
average_ratingusing the other columns. The dataset contains quite a few missing values, and rows where there are no reviews, where the score is
0. You'll need to remove these as you explore the data to make prediction easier.
Instructions
Readboard_games.csvinto a Dataframe called
board_gamesusing the Pandas library.
Print out the first few rows of
board_gamesand look closely at the data.
Use the dropna Dataframe method with the
axisargument set to
0to remove any rows that contain missing values.
Remove any rows in
board_gameswhere
users_ratedequals
0. This will remove any rows that have no reviews.
import pandas

board_games = pandas.read_csv("board_games.csv")
board_games = board_games.dropna(axis=0)
board_games = board_games[board_games["users_rated"] > 0]

board_games.head()
2: Picking An Error Metric
You want to predict theaverage_ratingcolumn using the other columns, but you'll need to do some data exploration before you're ready to do so. The exploration will help you understand the distribution of
average_ratingbetter, as well as select an error metric that you'll use to evaluate the performance of your machine learning model.
Instructions
Create a histogram of theaverage_ratingcolumn using thehist function.
Calculate the standard deviation of the
average_ratingcolumn and print it out.
Calculate the mean of the
average_ratingcolumn and print it out.
Think about what error metric might make sense for this data, and write a markdown cell with your thoughts.
%matplotlib inline
import matplotlib.pyplot as plt

plt.hist(board_games["average_rating"])
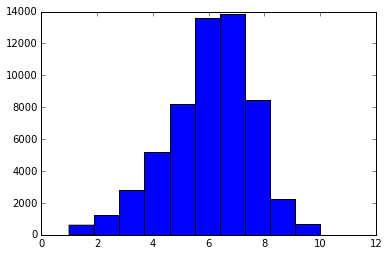
print(board_games["average_rating"].std())
print(board_games["average_rating"].mean())
1.57882993483
6.01611284933
Error metric
In this data set, using mean squared error as an error metric makes sense. This is because the data is continuous, and follows a somewhat normal distribution. We'll be able to compare our error to the standard deviation to see how good the model is at predictions.3: Plotting Clusters
Now that you have a handle on theaverage_ratingcolumn, and have picked an error metric, you're ready for the next step. If you haven't picked an error metric, you should look atMean Squared Error. As the data is continuous, and you want to penalize larger errors more, Mean Squared Error is a good error metric choice.
You can look at the data for patterns that may help you develop a machine learning model. One way to look for patterns is to use a clustering algorithm to create clusters, then plot them out.
You can first fit a KMeans class from the scikit-learn library. The KMeans class only works with numeric columns, so you have to extract the numeric columns of
board_gamesbefore passing them into the fit method of the KMeans class.
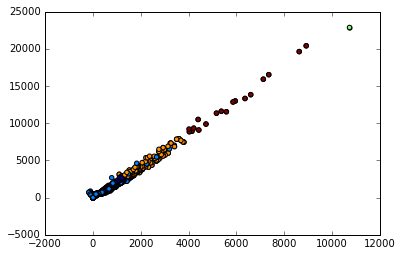
To plot out the cluster assignment, you first find the mean and standard deviation of each row, then make a scatterplot for mean vs standard deviation, then shade the points according to their cluster assignment.
Instructions
Use the KMeans class to create clusters.Initialize the KMeans class with
5clusters.
Extract the numeric columns of
board_games, and assign to the variable
numeric_columns.
Leave out
name,
type, and
id.
Fit the KMeans class to
numeric_columnsusing the fitmethod.
Extract the
labels_attribute of the KMeans class, and assign to the variable
labels.
Plot out the cluster assignments.
Use the apply method on
numeric_columnswith the keyword argument
axisset to
1to find the mean of each row. Assign the result to
game_mean.
Use the apply method on
numeric_columnswith the keyword argument
axisset to
1to find the standard deviation of each row. Assign the result to
game_std.
Create a plot using the matplotlib scatter function, with the
ckeyword argument set to
labels, the keyword argument
xset to
game_mean, and the keyword argument
yset to
game_std.
What do the results tell you? Write up the results in a markdown cell.
from sklearn.cluster import KMeans

clus = KMeans(n_clusters=5)
cols = list(board_games.columns)
cols.remove("name")
cols.remove("id")
cols.remove("type")
numeric = board_games[cols]

clus.fit(numeric)
import numpy game_mean = numeric.apply(numpy.mean, axis=1) game_std = numeric.apply(numpy.std, axis=1)
labels = clus.labels_
plt.scatter(x=game_mean, y=game_std, c=labels)
4: Finding Correlations
Now that you're done some data exploration, you can figure out which columns correlate well withaverage_rating. This will enable you to remove columns that don't add much predictive power to the model. Columns that are uncorrelated with the target won't help a linear regression model, which is what you'll be using. It will also enable you to remove columns that are derived from the target, or otherwise cause overfitting.
Instructions
Use the corr method onnumeric_columnsto compute correlations between columns. Assign the result to
correlations.
Print out the
average_ratingcolumn of
correlations. This shows how much each column in
numeric_columnsis correlated with
average_rating.
Do any of the correlations surprise you? Write up your thoughts in a markdown cell.
Figure out which columns, if any, you want to remove.
Make sure to remove
bayes_average_rating, which appears to be somehow calculated from
average_rating, and would cause the model to overfit.
Game clusters
It looks like most of the games are similar, but as the game attributes tend to increase in value (such as number of users who rated), there are fewer high quality games. So most games don't get played much, but a few get a lot of playerscorrelations = numeric.corr() correlations["average_rating"]
Correlations
Theyearpublishedcolumn is surprisingly highly correlated with
average_rating, showing that more recent games tend to be rated more highly. Games for older players (
minageis high) tend to be more highly rated. The more "weighty" a game is (
average_weightis high), the more highly it tends to be rated.
5: Creating A Model
Now that you're done exploring the data, you're ready to create a linear regression model and make predictions for newly created board games.Ordinarily, you'd want to split the data into training and testing sets, train the algorithm on the training set, and test its performance on the test set. In this case, because we haven't covered training and testing sets yet, you'll evaluate the performance of the model on the training set.
You'll fit a linear regression model to
board_games, using the columns you think should be predictors, and
average_ratingas the target. You'll then generate predictions using the same predictors you used in the fitting process.
Instructions
Initialize a LinearRegression model, and assign it to the variablereg.
Use the fit method on
regto fit the model using the columns of
board_gamesthat you think should be used as predictors, and the
average_ratingcolumn of
board_gamesas the target.
Make sure not to include
average_ratingin the predictors.
Use the predict method to make predictions using the columns of
board_gamesthat you think should be used as predictors.
The predictors you pass into predict should be the same predictors you passed into fit.
Assign the result to
predictions.
Calculate the error metric you chose.
Write up what the error value tells you in a markdown cell.
from sklearn.linear_model import LinearRegression

reg = LinearRegression()
cols.remove("average_rating")
cols.remove("bayes_average_rating")
reg.fit(board_games[cols], board_games["average_rating"])
predictions = reg.predict(board_games[cols])

numpy.mean((predictions - board_games["average_rating"]) ** 2)
6: Next Steps
That's it for the guided steps! We recommend exploring the data more on your own.Here are some potential next steps:
Split the data into training and testing sets, and calculate error on the testing set.
Try algorithms other than linear regression.
Calculate new predictors based off the existing columns, such as:
Player range (
maxplayers-
minplayers)
Playing time range (
maxplaytime-
minplaytime)
Average number of ratings (
total_owners/
users_rated)
Scrape the latest data from BoardGameGeekto increase the size of the dataset.
Scrape additional data from BoardGameGeekto add in more columns.
We recommend creating a Github repository and placing this project there. It will help other people, including employers, see your work. As you start to put multiple projects on Github, you'll have the beginnings of a strong portfolio.
You're welcome to keep working on the project here, but we recommend downloading it to your computer using the download icon above and working on it there.

相关文章推荐
- 2011阿里巴巴程序设计公开赛 / 1009 Board Game Dice
- HDU 3959 Board Game Dice
- 武士之旅小游戏(Chess Board game: Tour of knight)
- 2011 Alibaba Programming Contest_1009_Board Game Dice
- POJ 2697 A Board Game (bfs模拟)
- Building a WPF Sudoku Game, Part 2: The Board UI and Validation
- nyoj 408 Board Game Dice
- Game Center Achievements and Leaderboards part 1 <转>
- Building a WPF Sudoku Game, Part 2: The Board UI and Validation (zz)
- POJ 1735 A Game on the Chessboard 笔记
- zoj 3352 Boring Board Game
- POJ 2697 - A Board Game
- Guided Project: Predicting the stock market
- How to play BreakerBall game on DragonBoard 410c ?
- Chalkboard XOR Game
- 810. Chalkboard XOR Game
- Google Play Game Services LeaderBoard
- Guided Project: Analyzing movie reviews
- NYOJ--408题Board Game Dice
- poj 2697 A Board Game-dfs