Tensorflow: Linear Regression
2016-06-28 22:57
309 查看
modified from https://github.com/sjchoi86/tensorflow-101/blob/master/notebooks/logistic_regression_mnist.ipynb
toy dataset
import numpy as np
import os
from scipy.misc import imread, imresize
import matplotlib.pyplot as plt
import pprint
from sklearn.datasets import load_boston

def toy_dataset(n):
w, b = 0.7, -1
noise_var = 0.001
x   = np.random.random((1, n))
gt = w * x + b
label  = gt + np.sqrt(noise_var)*np.random.randn(1, n)
return x, gt, label

n_samples = 100
data, gt, label = toy_dataset(n_samples)
print (" Type of 'train_X' is ", type(data))
print (" Shape of 'train_X' is %s" % (data.shape,))
print (" Type of 'train_Y' is ", type(label))
print (" Shape of 'train_Y' is %s" % (label.shape,))

plt.figure(1)
plt.plot(x[0, :], gt[0, :], 'ro', label='Original data')
plt.plot(x[0, :], y[0, :], 'bo',  label='Training data')
plt.axis('equal')
plt.legend(loc='lower right')
plt.show()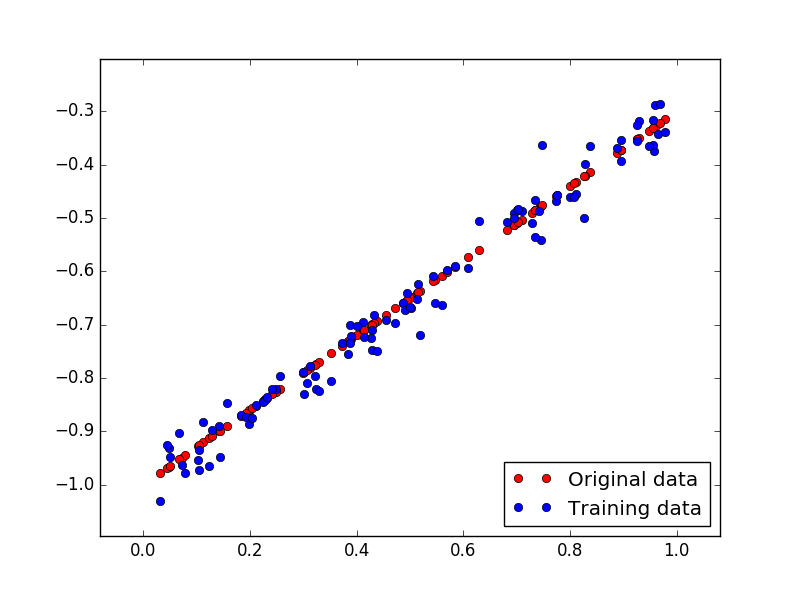
linear regression
X = tf.placeholder(tf.float32, name='input')
Y = tf.placeholder(tf.float32, name='output')
w = tf.Variable(np.random.randn(), name='weight')
b = tf.Variable(np.random.randn(), name='bias')

act = tf.add(tf.mul(X,w), b)

lr = 0.001
loss = tf.reduce_mean(tf.pow(act-Y,2))
# optimizer = tf.train.GradientDescentOptimizer(lr).minimize(loss)
optimizer = tf.train.RMSPropOptimizer(lr, 0.9).minimize(loss)
init = tf.initialize_all_variables()

sess = tf.Session()
sess.run(init)

training_epochs = 5000
snapshot = 50
loss_cache = []
for epoch in xrange(training_epochs):
for x, y in zip(data, label):
out = sess.run([optimizer, loss, w, b], feed_dict={X:x, Y:y})
loss_cache.append(out[1])
if epoch % snapshot == 0:
print '[Epoch: %d] loss: %.4f, w: %.4f, b: %.4f' % (epoch, out[1], out[2], out[3])

w_new = sess.run(w)
b_new = sess.run(b)
y_pre = x * w_new + b_new

print y_pre.shape

plt.figure(2)
plt.plot(data[0,:], gt[0,:], 'ro', label='Ground Truth')
plt.plot(data[0,:], label[0,:], 'bo', label='Training Label')
plt.plot(data[0,:], y_pre, 'k-', label='Fitted Line')
plt.axis('equal')
plt.legend(loc='lower right')
plt.show()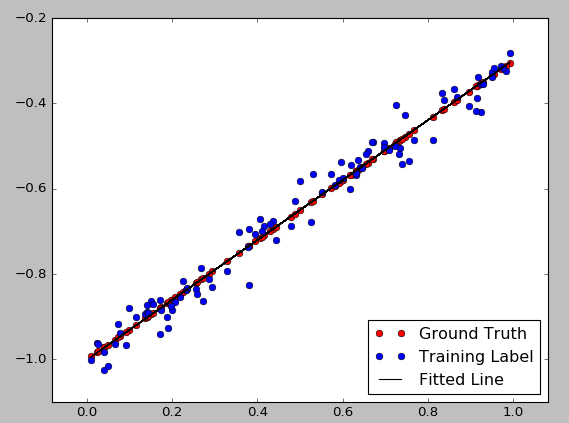
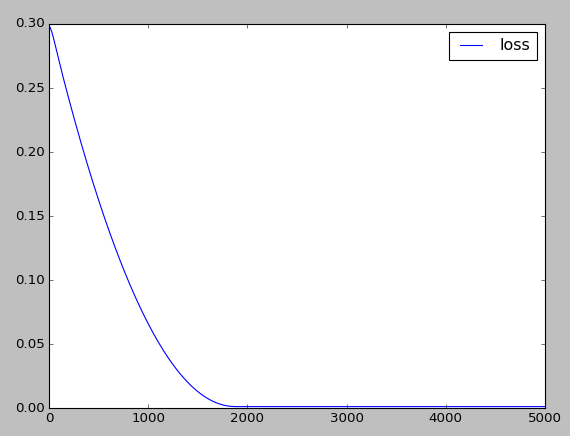
plt.figure(3)
plt.plot(range(training_epochs), loss_cache, 'b-', label='loss')
plt.legend(loc='upper right')
plt.show()

相关文章推荐
- pl/sql表类型
- libuv学习笔记(18)
- HTTP连接管理
- Spring中bean用法详解
- 字符设备驱动
- 【SQL】 sql中的日期比较
- Android数据库框架——ORMLite轻量级的对象关系映射(ORM)Java包
- Android数据库框架——ORMLite轻量级的对象关系映射(ORM)Java包
- 提高项目12.1-数组大折腾 加倍
- TCP、IP详解(转)
- 加载图片出现OOM
- SSRF漏洞分析,利用及其防御
- 新路线
- Spring LDAP
- hover显示遮罩层及border旋转
- 匿名内部类实现接口,继承类
- linux日志文件说明
- loadrunner函数
- NOIP2015 Revenge
- CQUOJ月赛(5月)H题:zzblack与斐波那契数列