Kylin-web上的数据分析
2016-05-26 16:40
302 查看
Kylin Web Interface
Supported BrowsersWindows: Google Chrome, FireFox
Mac: Google Chrome, FireFox, Safari
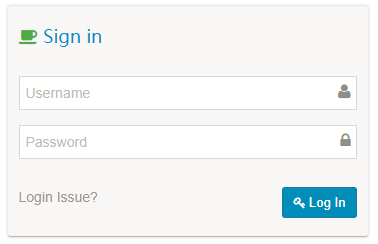
1. Access & Login
Host to access: http://hostname:7070Login with username/password: ADMIN/KYLIN
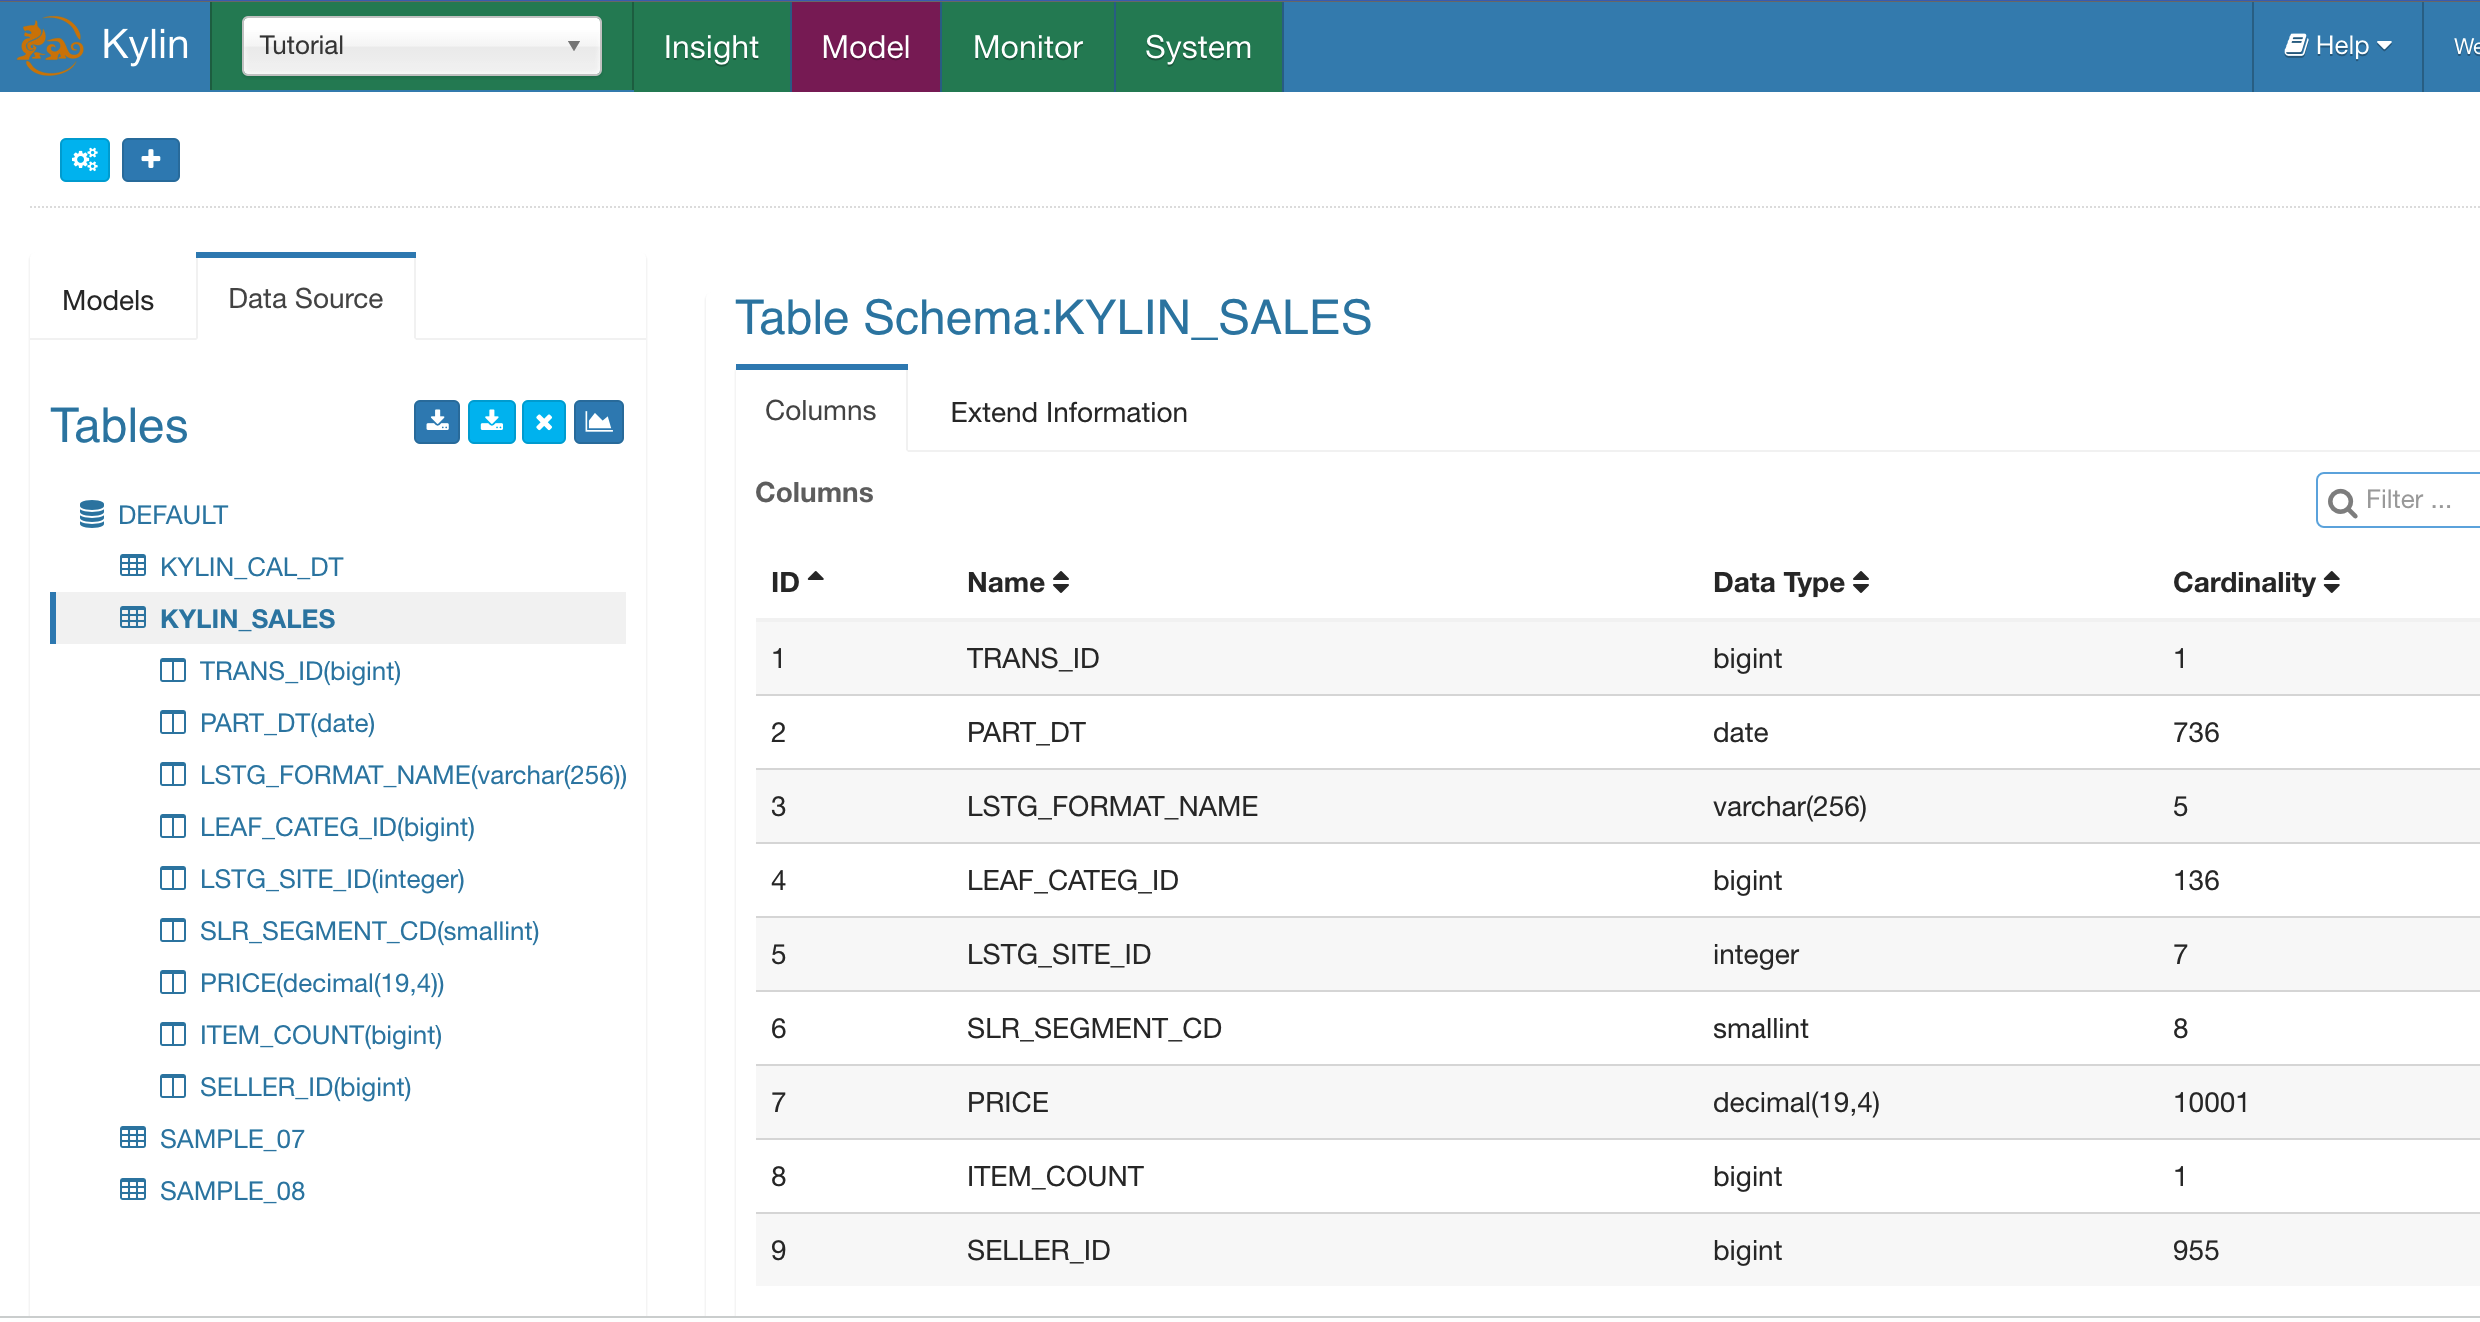
2. Sync Hive Table into Kylin
Although Kylin will using SQL as query interface and leverage Hive metadata, kylin will not enable user to query all hive tables since it’s a pre-build OLAP (MOLAP) system so far. To enable Table in Kylin, it will be easy to using “Sync” function to syncup tables from Hive.
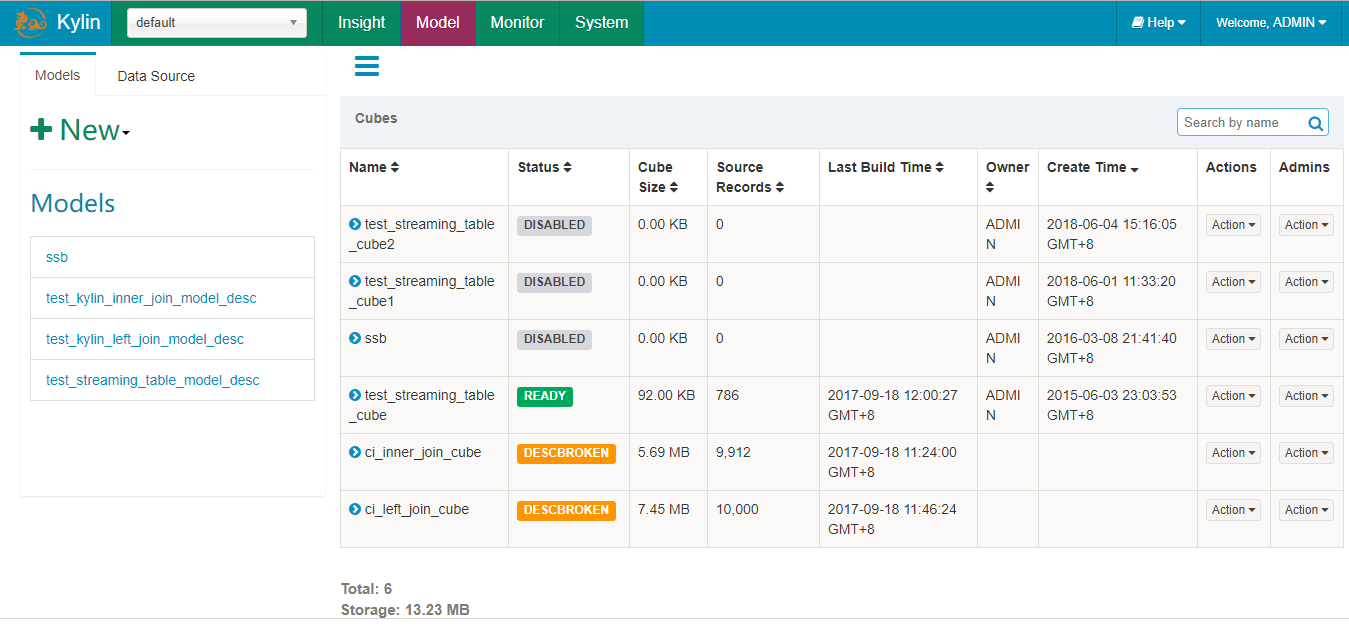
3. Kylin OLAP Cube
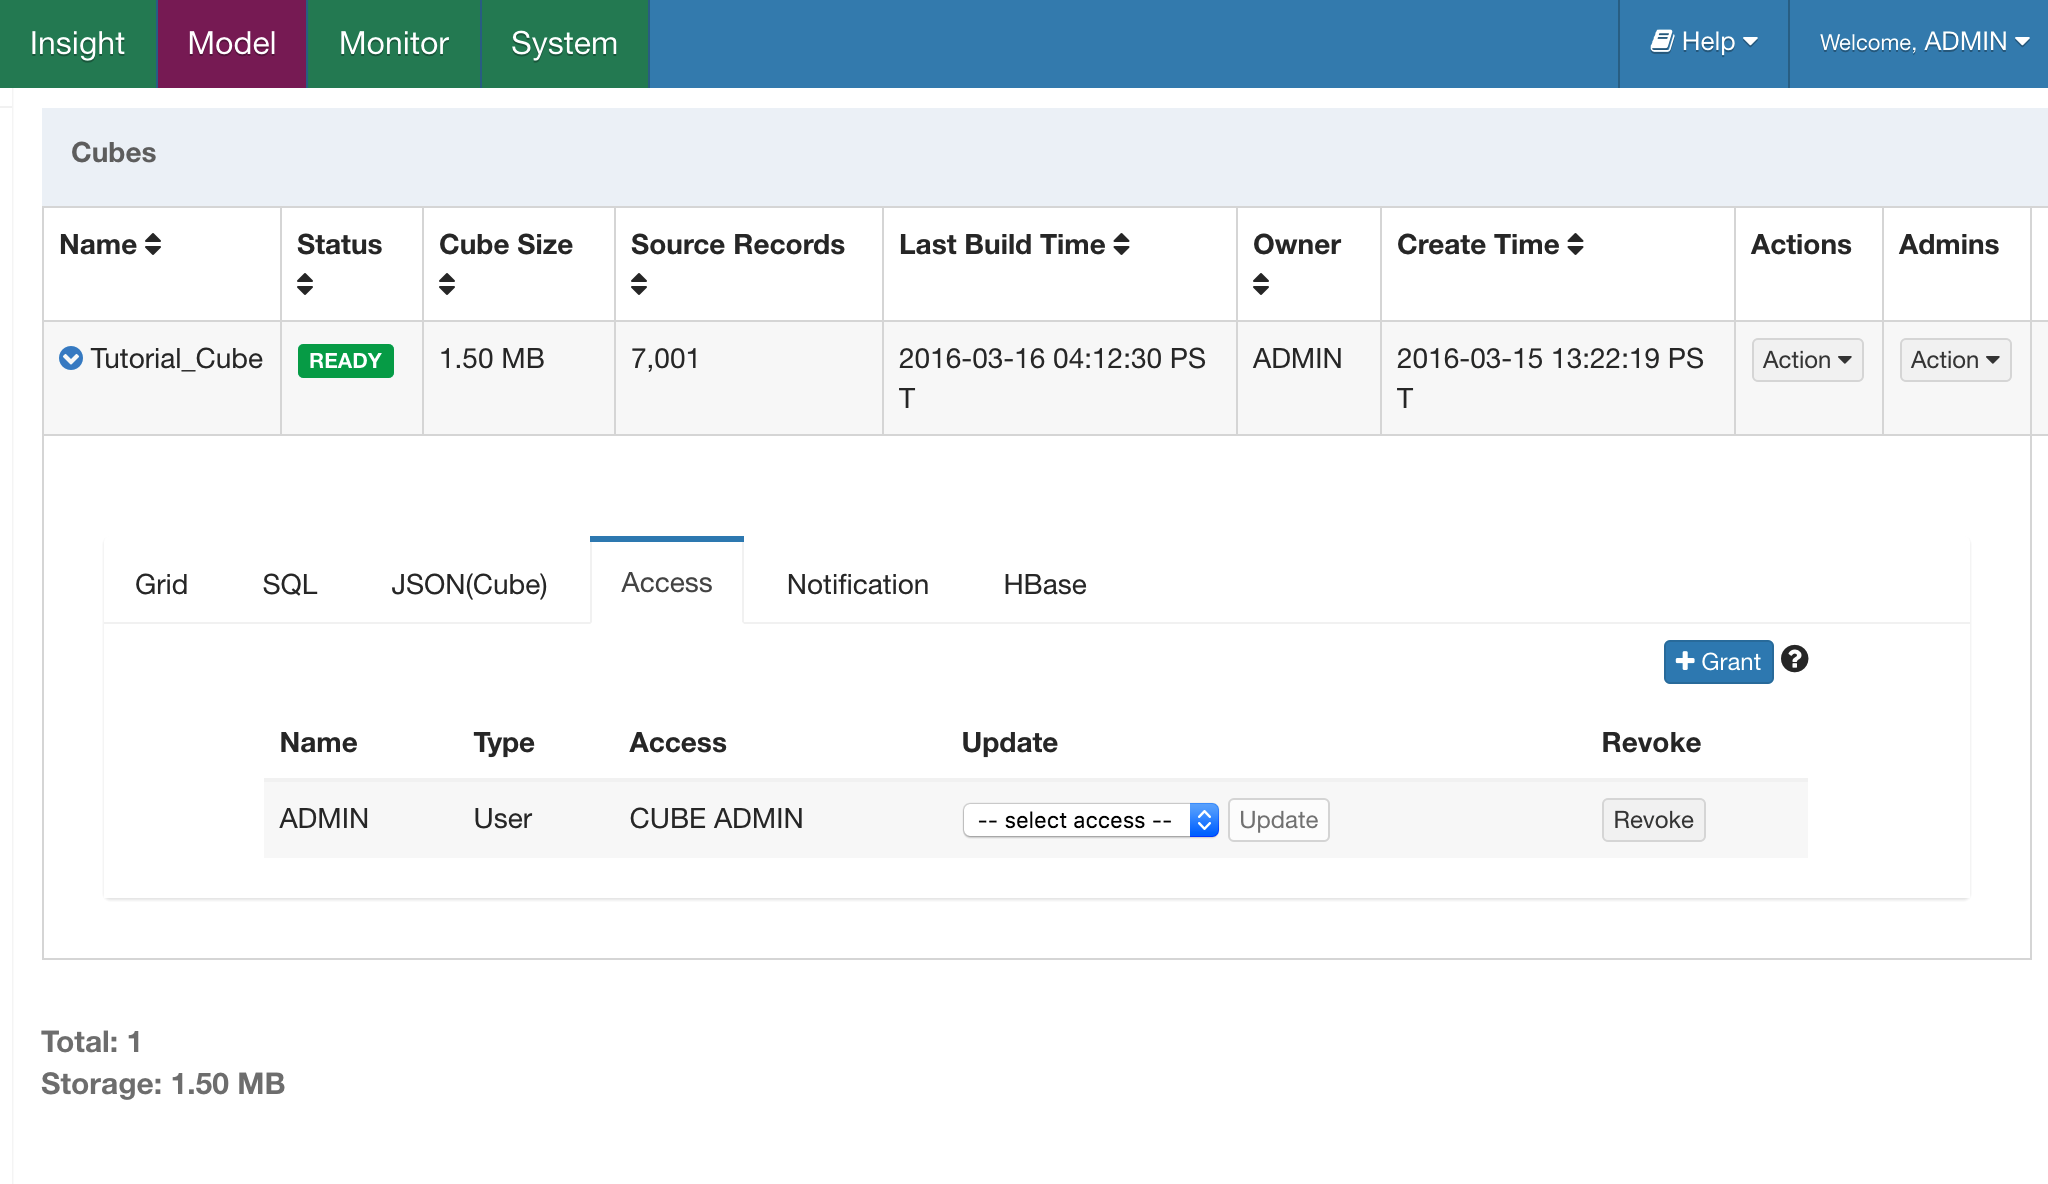
Kylin’s OLAP Cubes are pre-calculation datasets from star schema tables, Here’s the web interface for user to explorer, manage all cubes. Go toModelmenu, it will list all cubes available in system:
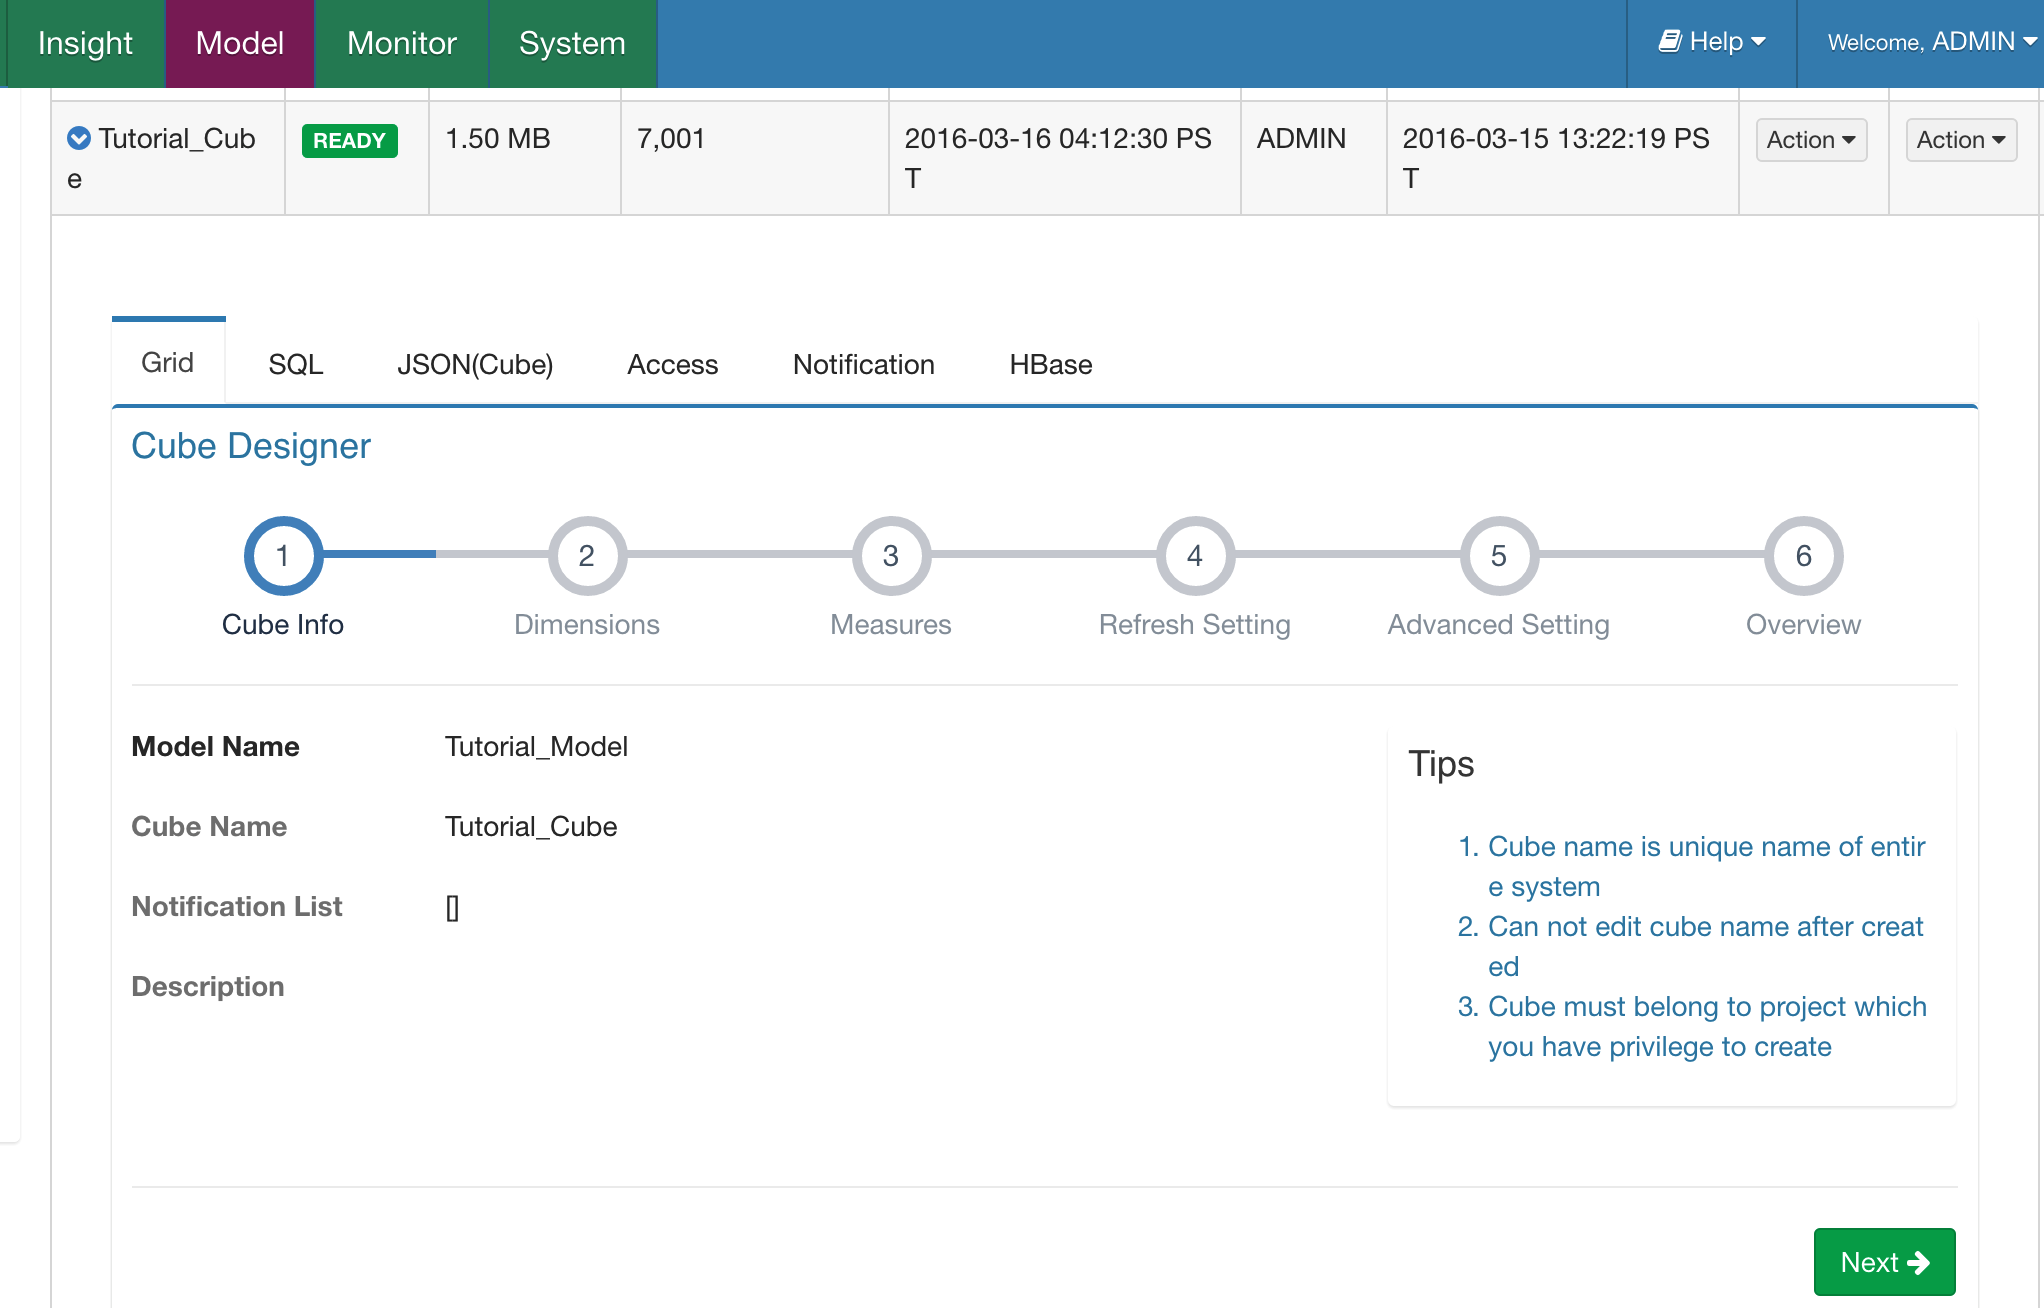
To explore more detail about the Cube
Form View:
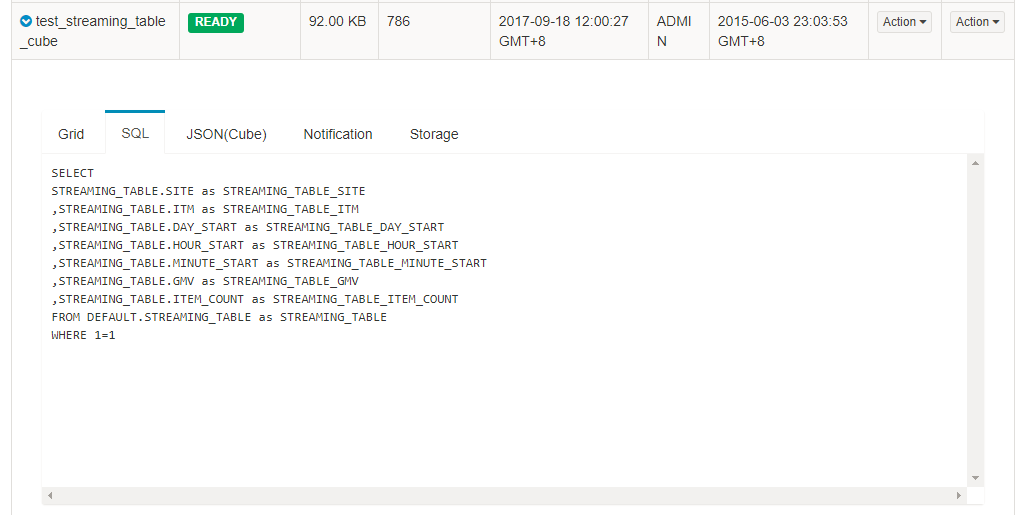
SQL View (Hive Query to read data to generate the cube):
Access (Grant user/role privileges, grant operation only open to Admin):
4. Write and Execute SQL on web
Kylin’s web offer a simple query tool for user to run SQL to explorer existing cube, verify result and explorer the result set using #5’s Pivot analysis and visualizationQuery Limit
Only SELECT query be supported
SQL will not be redirect to Hive
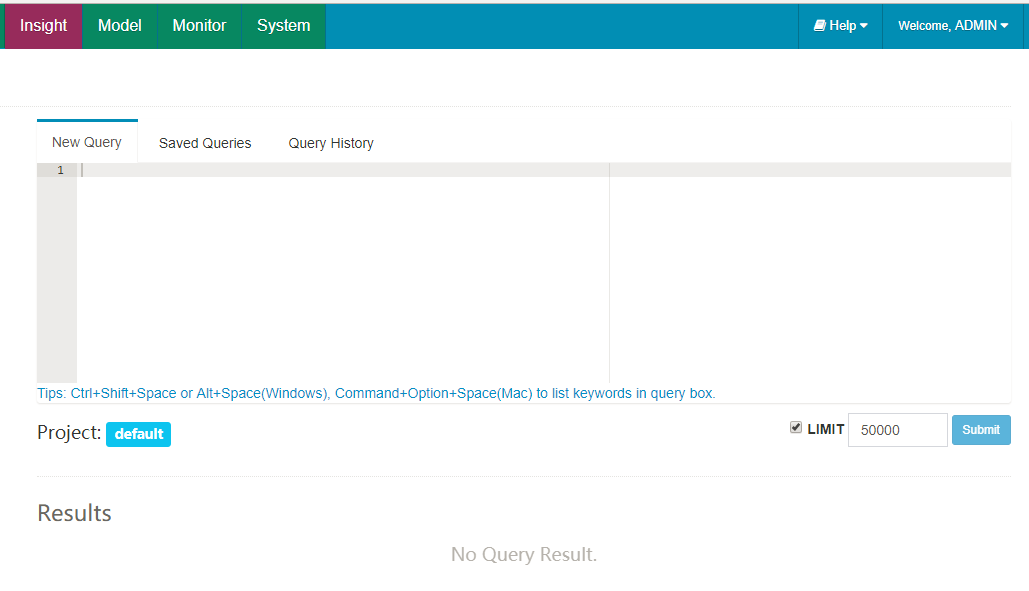
Go to “Insight” menu:
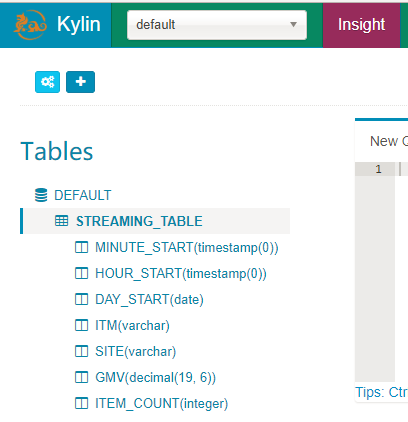
Source Tables:
Browser current available tables (same structure and metadata as Hive):
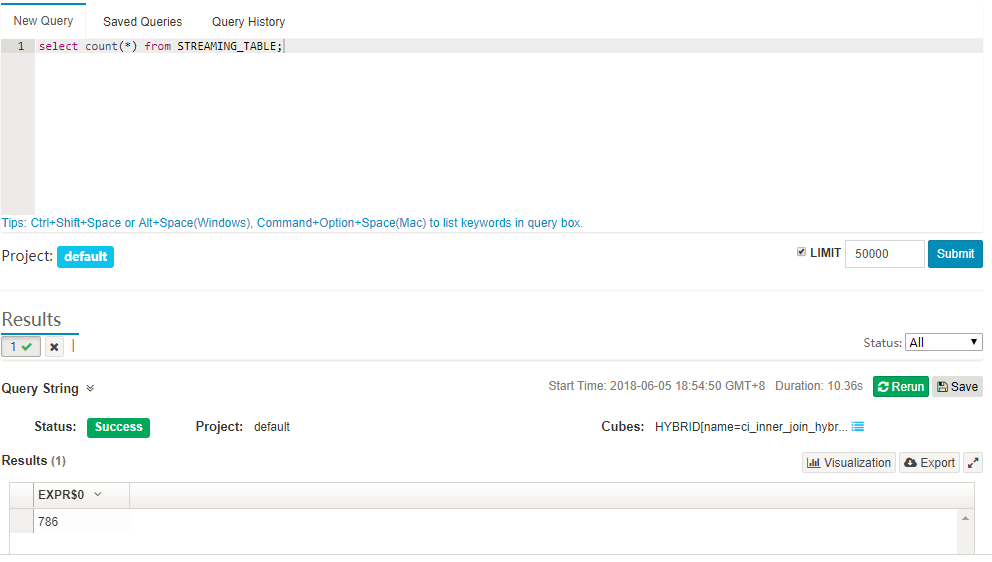
New Query:
You can write and execute your query and explorer the result.
Saved Query (only work after enable LDAP security):
Associate with user account, you can get saved query from different browsers even machines.
Click “Save” in Result area, it will popup for name and description to save current query:
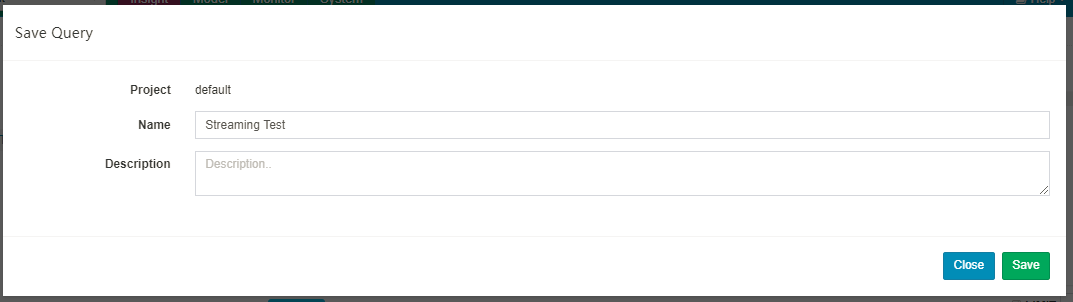
Click “Saved Queries” to browser all your saved queries, you could direct submit it or remove it.
Query History:
Only keep the current user’s query history in current bowser, it will require cookie enabled and will lost if you clean up bowser’s cache. Click “Query History” tab, you could directly resubmit any of them to execute again.
5. Pivot Analysis and Visualization
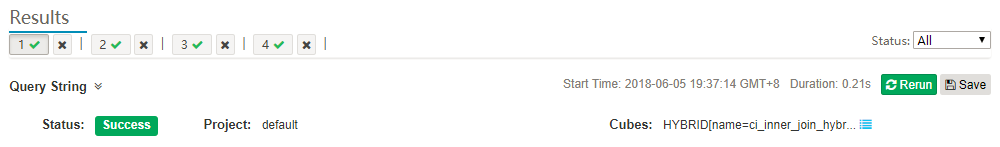
There’s one simple pivot and visualization analysis tool in Kylin’s web for user to explore their query result:General Information:
When the query execute success, it will present a success indictor and also a cube’s name which be hit.
Also it will present how long this query be executed in backend engine (not cover network traffic from Kylin server to browser):
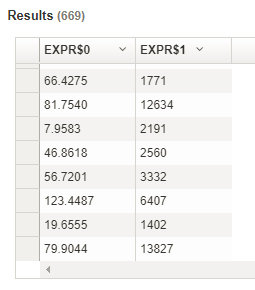
Query Result:
It’s easy to order on one column.
Export to CSV File
Click “Export” button to save current result as CSV file.
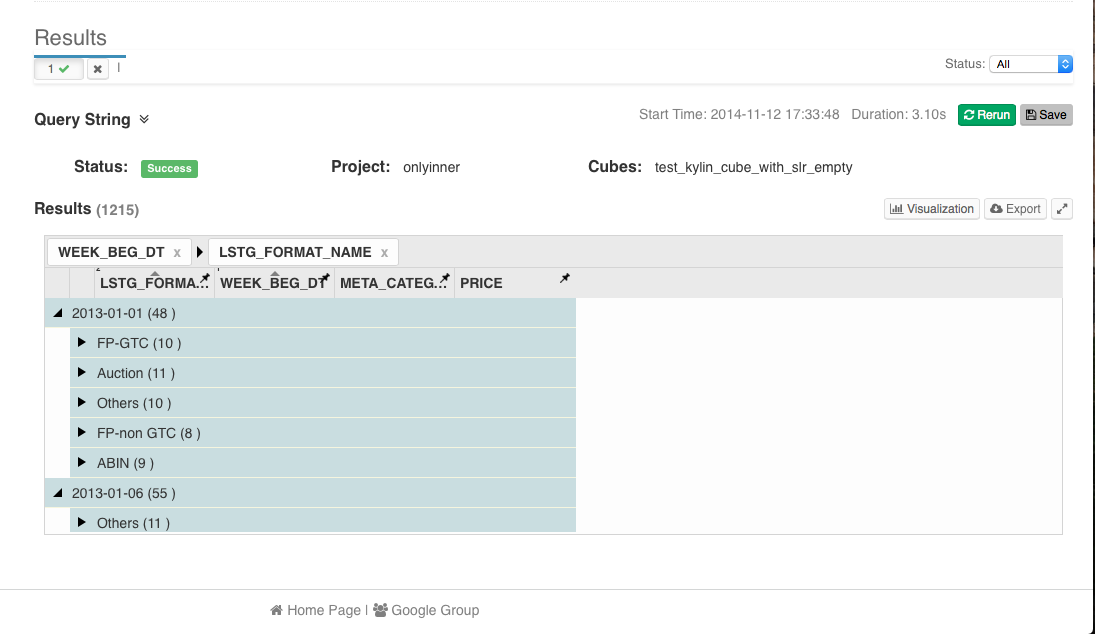
Pivot Table:
Drag and drop one or more columns into the header, the result will grouping by such column’s value:
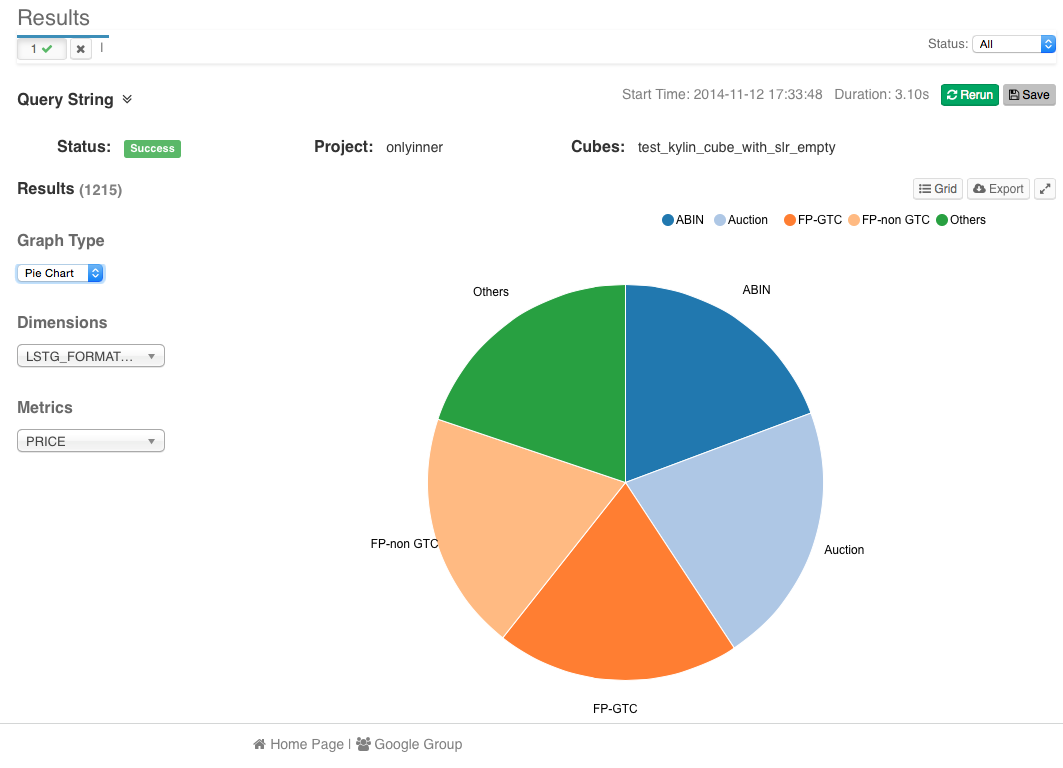
Visualization:
Also, the result set will be easy to show with different charts in “Visualization”:
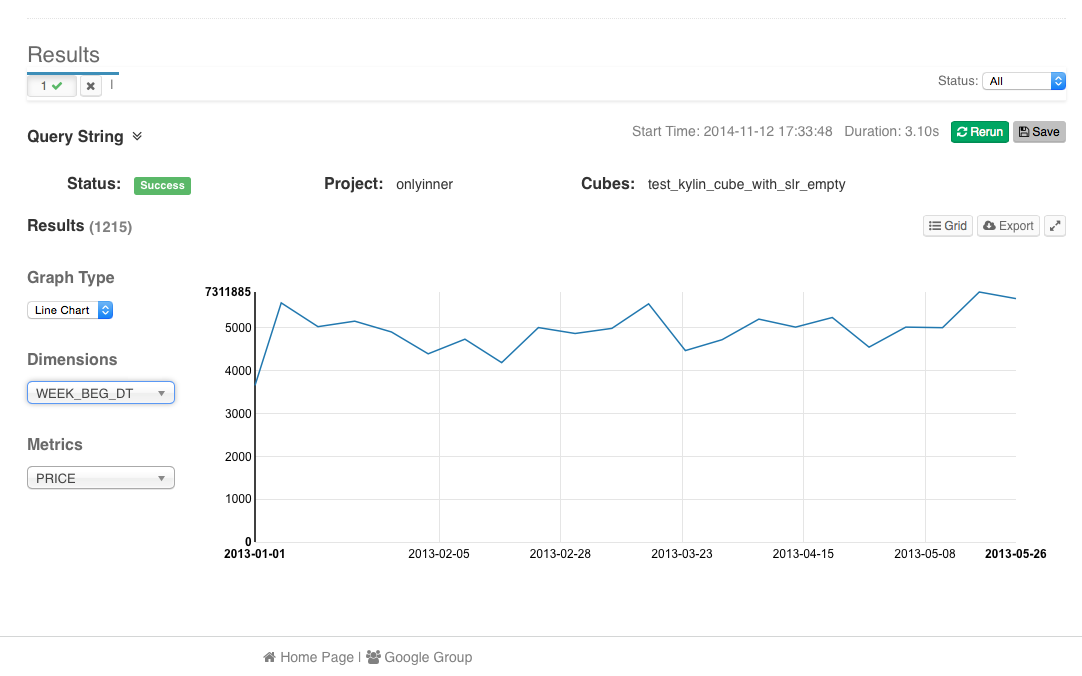
note: line chart only available when there’s at least one dimension with real “Date” data type of column from Hive Table.
Bar Chart:
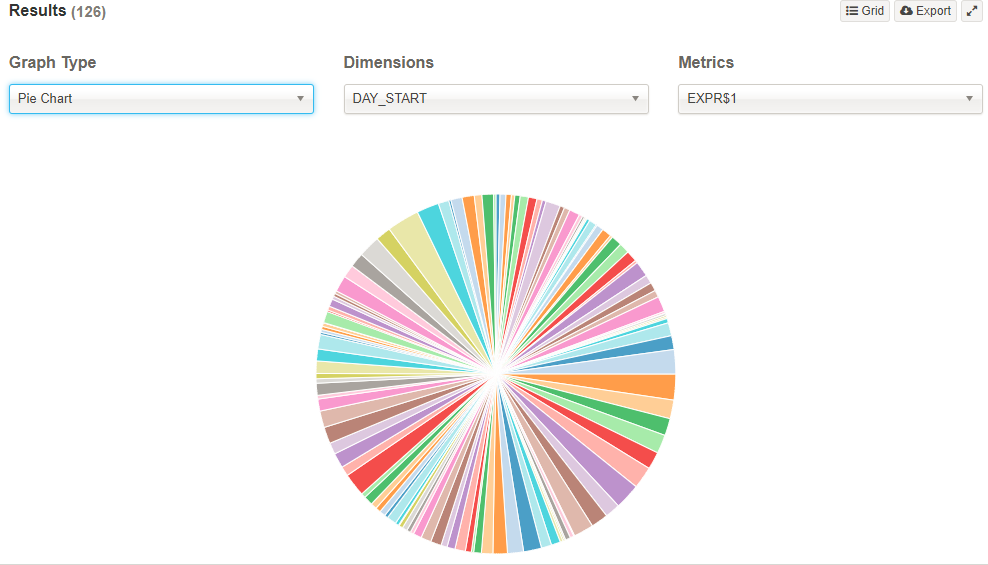
Pie Chart:
Line Chart

相关文章推荐
- 正则表达式【项目中碰到使用的】
- 安卓View开发心得(一)
- include 布局android:layout_below属性无法使用
- linux之bash介绍
- 一行行看SDWebImage源码(一)
- mysql slow_log 记录和获取
- Kafka入门教程
- Css选择器
- PHP浮点数的精确计算BCMath
- 如何开启Centos6.4系统的SSH服务
- 如何判断pc或者移动端
- MDK中寄存器地址名称映射分析
- Why can't we change access modifier while overriding methods in C#?
- python(十二)I/O编程
- Android-->EventBus 3.0新版使用说明(及其使用方法)
- 一起来学Android Studio:(四)导入eclipse项目
- EasyDarwin返回401 Unauthorized解决方法
- Kylin Cube 的权限管理
- Android集成PayPal支付
- 辨析JavaScript中的Undefined类型与null类型