grafana图形化数据展示软件介绍
2016-04-04 22:43
134 查看
http://grafana.org/
一、从官网上看一下特色
Click and select region to zoom
Multiple Y-Axes
Bars, Lines, Points
Thresholds, Logarithmic scales
Y-axis formats (bytes, milliseconds, etc)
View or edit graph in fullscreen

Mix lines, bars and points
Mix stacked series with isolated series
Export any graph to png image (via UI or HTTP API)
Search dashboards based on title or tags
Templated dashboards
Scripted dashboards
Dashboard playlists
Create / Update HTTP API
Different panel types
二、国内的一些尝试

想打造 New Relic 那样漂亮的实时监控系统我们只需要 InfluxDB/collectd/Grafana 这三个工具,这三个工具的关系是这样的:
采集数据(collectd)-> 存储数据(InfluxDB) -> 显示数据(Grafana)。
InfluxDB 是 Go 语言开发的一个开源分布式时序数据库,非常适合存储指标、事件、分析等数据,看版本号(v0.8.8)就知道这个项目还很年轻;
collectd 就不用介绍了吧,C 语言写的一个系统性能采集工具;
Grafana 是纯 Javascript 开发的前端工具,用于访问 InfluxDB,自定义报表、显示图表等。
下面的安装和配置步骤在
Ubuntu 14.04 Server 64bit 版上完成。升级整个系统后重启:
一、从官网上看一下特色
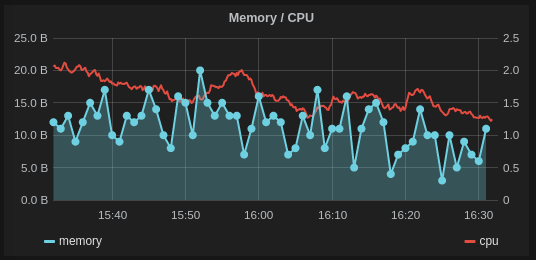
Rich Graphing
Fast and flexible client side graphs with a multitude of options.Click and select region to zoom
Multiple Y-Axes
Bars, Lines, Points
Thresholds, Logarithmic scales
Y-axis formats (bytes, milliseconds, etc)
View or edit graph in fullscreen
Graph Styling
Full control for how each series should be drawnMix lines, bars and points
Mix stacked series with isolated series
Export any graph to png image (via UI or HTTP API)
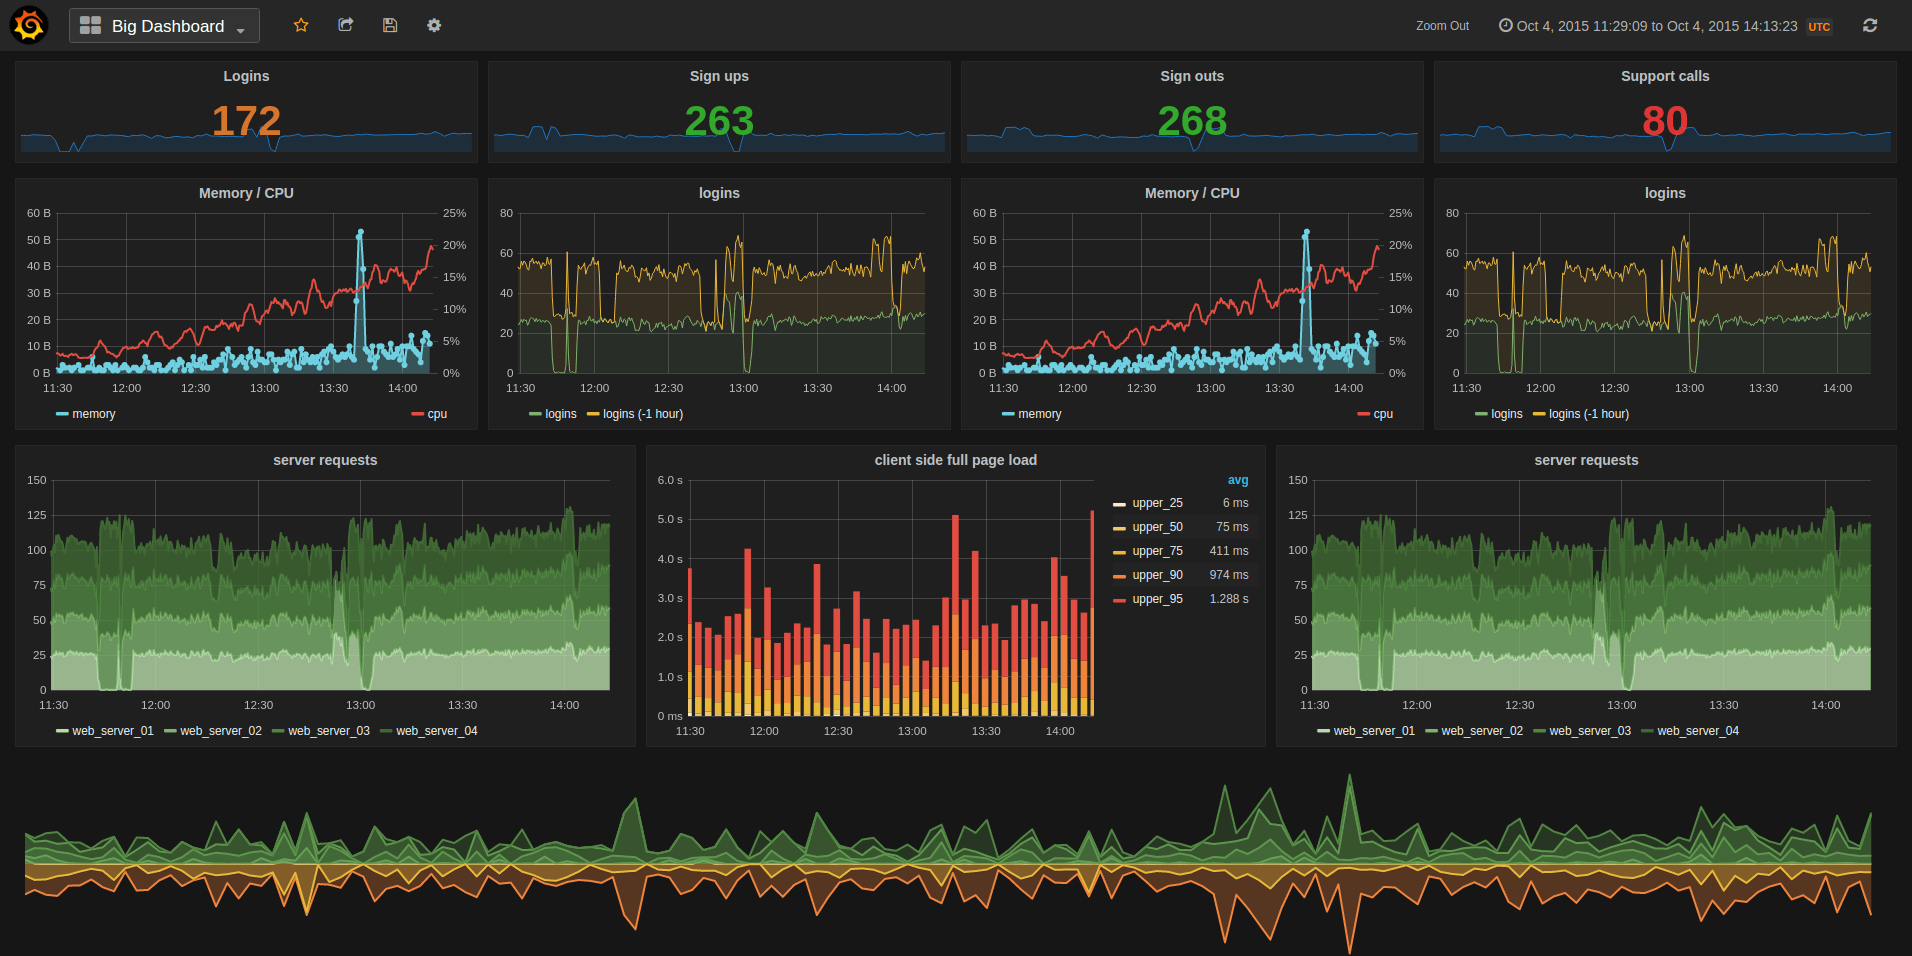
Dashboards
Drag and drop panels, change row and panel width easily.Search dashboards based on title or tags
Templated dashboards
Scripted dashboards
Dashboard playlists
Create / Update HTTP API
Different panel types
二、国内的一些尝试
使用 Grafana、collectd 和 InfluxDB 打造现代监控系统
http://www.linuxidc.com/Linux/2015-04/116123.htm想打造 New Relic 那样漂亮的实时监控系统我们只需要 InfluxDB/collectd/Grafana 这三个工具,这三个工具的关系是这样的:
采集数据(collectd)-> 存储数据(InfluxDB) -> 显示数据(Grafana)。
InfluxDB 是 Go 语言开发的一个开源分布式时序数据库,非常适合存储指标、事件、分析等数据,看版本号(v0.8.8)就知道这个项目还很年轻;
collectd 就不用介绍了吧,C 语言写的一个系统性能采集工具;
Grafana 是纯 Javascript 开发的前端工具,用于访问 InfluxDB,自定义报表、显示图表等。
下面的安装和配置步骤在
Ubuntu 14.04 Server 64bit 版上完成。升级整个系统后重启:
$ sudo apt-get update
$ sudo apt-get upgrade
$ sudo reboot
安装 InfluxDB
InfluxDB 是 Go 写的,不依赖任何其他包或库,很干净。安装很容易:$ wget https://s3.amazonaws.com/influxdb/influxdb_latest_amd64.deb[/code]$ sudo dpkg -i influxdb_latest_amd64.deb
启动 InfluxDB:$ sudo /etc/init.d/influxdb startSetting ulimit -n 65536Starting the process influxdb [ OK ]influxdb process was started [ OK ]
启动后打开 web 管理界面 http://192.168.2.183:8083/ 默认用户名和密码是 root 和 root. InfluxDB 的 Web 管理界面端口是 8083,HTTP API 监听端口是 8086,如果需要更改这些默认设定,修改 InfluxDB 的配置文件 /opt/influxdb/current/config.toml 后重启 InfluxDB 就可以了。
在刚安装好的 InfluxDB 上创建一个名为 collectd 的数据库,可以用命令行创建,也可以用 Web 管理界面操作:$ curl "http://192.168.2.183:8086/db?u=root&p=root"-d "{\"name\": \"collectd\"}"安装 collectd
安装 collectd:$ sudo apt-get install collectd
配置 collectd 为客户端,收集到数据后直接发给 InfluxDB:$ sudo vi /etc/collectd/collectd.conf...LoadPlugin network...<Plugin network>Server"192.168.2.183""25826"</Plugin>...
重启 collectd:$ sudo /etc/init.d/collectd restart
InfluxDB 现在自带一个 collectd 插件来获取 collectd 客户端发来的数据,以前可没这么方便哦,0.8.4 版本以前只能通过 influxdb-collectd-proxy 这样的第三方程序来连接 collectd 和 InfluxDB. 如果你检查一下服务器上打开的端口就会发现 influxdb 插件启动了一个 25826 端口,如果发现 InfluxDB 数据库里没有(收集到)数据,务必检查这个 25826 端口是否正常启动了:$ sudo netstat -tuplnActiveInternet connections (only servers)ProtoRecv-Q Send-Q LocalAddressForeignAddressState PID/Program nametcp 000.0.0.0:220.0.0.0:* LISTEN 622/sshdtcp6 00:::8086:::* LISTEN 668/influxdbtcp6 00:::22:::* LISTEN 622/sshdtcp6 00:::8090:::* LISTEN 668/influxdbtcp6 00:::8099:::* LISTEN 668/influxdbtcp6 00:::8083:::* LISTEN 668/influxdbudp6 00:::25826:::*668/influxdb
InfluxDB 自带的 collectd 插件默认是关闭的,需要手动配置打开 enabled = true,并填上 database = “collectd” 这一行,这里的 “collectd” 就是我们上面创建的那个数据库,更改配置后记得重启 InfluxDB:$ sudo vi /opt/influxdb/current/config.toml$ sudo vi /opt/influxdb/shared/config.toml...# Configure the collectd api[input_plugins.collectd]enabled =true# address = "0.0.0.0" # If not set, is actually set to bind-address.# port = 25826database ="collectd"# types.db can be found in a collectd installation or on github:# https://github.com/collectd/collectd/blob/master/src/types.db[/code]# typesdb = "/usr/share/collectd/types.db" # The path to the collectd types.db file...$ sudo /etc/init.d/influxdb restartSetting ulimit -n 65536Setting ulimit -n 65536influxdb process was stopped [ OK ]Setting ulimit -n 65536Starting the process influxdb [ OK ]influxdb process was started [ OK ]
现在 InfluxDB 已经准备好接受和处理 collectd 传来的数据了。用命令行或者 Web 管理界面验证一下数据库里是否有数据:$ curl -G 'http://192.168.2.183:8086/db/collectd/series?u=root&p=root&q=list+series&pretty=true'[{"name":"list_series_result","columns":["time","name"],"points":[[0,"192.168.2.183/cpu-0/cpu-idle"],...]}]安装 Grafana
下载 grafana 后解压放到 web 服务器上就可用。这里省去配置 Nginx/Apache 之类的麻烦,直接用最简单的 Web 服务器 python -m SimpleHTTPServer 驱动:$ wget http://grafanarel.s3.amazonaws.com/grafana-1.9.1.tar.gz[/code]$ tar xzvf grafana-1.9.1.tar.gz$ cd grafana-1.9.1.tar.gz$ cp config.sample.js config.js$ vi config.js...// InfluxDB example setup (the InfluxDB databases specified need to exist)datasources:{influxdb:{type:'influxdb',url:"http://192.168.2.183:8086/db/collectd",username:'root',password:'root',},...},...$ sudo python -m SimpleHTTPServer
用浏览器访问 Grafana,这里的默认端口是 8000:


相关文章推荐
- Socket使用大全
- MQTT协议学习笔记
- shiro整合redis做缓存
- storm安装
- strcpy 字符串拷贝函数解析
- 二叉树遍历
- SignalR技术
- 借助 Lucene.Net 构建站内搜索引擎(下)
- 20159315《网络攻防实践》第五周学习总结
- 多线程并发测试代码及解决方法
- Content Delivery Network (CDN)
- BitNami 里有好多开源软件
- HDU 5631 Rikka with Graph(无向图去边搜索)
- ecshop:Warning: strpos(): Empty delimiter in E:\WebRoot\...\includes\lib_main.php on line1995
- 项目1-分数的雏形
- java中IO类的各种操作
- Vim 基础
- php核心知识纲要总结以及学习路线
- oracle undo表空间的创建与管理
- Android 使用 Gradle 多渠道打包