关于KMeans 最外围点移除实验(其中心保持不变)
2016-03-30 16:23
309 查看
import matplotlib.pyplot as plt
from sklearn.datasets import make_blobs
import numpy as np
X,labels = make_blobs(100,centers=1)
from sklearn.cluster import KMeans
kmeans = KMeans(n_clusters=1)
kmeans.fit(X)
f, ax = plt.subplots(figsize=(7, 5))
ax.set_title("Blob")
ax.scatter(X[:, 0], X[:, 1], label='Points')
ax.scatter(kmeans.cluster_centers_[:, 0],kmeans.cluster_centers_[:, 1], label='Centroid',color='r')
ax.legend()
f.show()
distances = kmeans.transform(X)
# argsort returns an array of indexes which will sort the array in ascending order
# so we reverse it via [::-1] and take the top five with [:5]
#先把数组展开,逆向排序,选前5个,就是最外面的轮廓的索引
sorted_idx = np.argsort(distances.ravel())[::-1][:5]
#Now, let's see which plots are the farthest away:
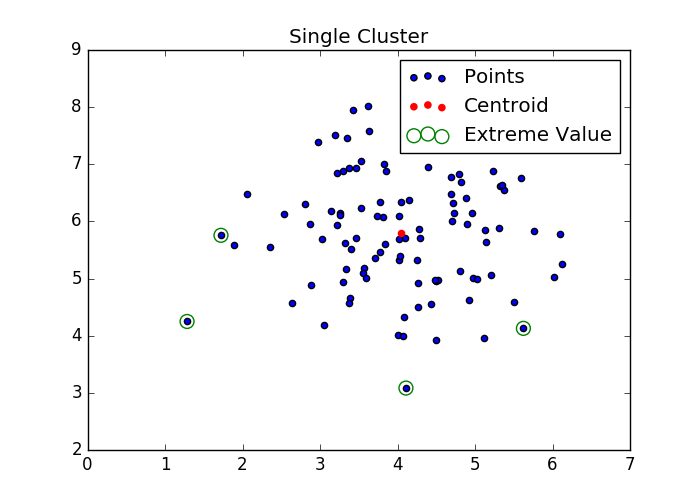
f, ax = plt.subplots(figsize=(7, 5))
ax.set_title("Single Cluster")
ax.scatter(X[:, 0], X[:, 1], label='Points')
ax.scatter(kmeans.cluster_centers_[:, 0],kmeans.cluster_centers_[:, 1],label='Centroid', color='r')
ax.scatter(X[sorted_idx][:, 0], X[sorted_idx][:, 1],label='Extreme Value', edgecolors='g',facecolors='none', s=100)
ax.legend(loc='best')
f.show()
new_X = np.delete(X, sorted_idx, axis=0)
#Also, the centroid clearly changes with the removal of these points:
new_kmeans = KMeans(n_clusters=1)
new_kmeans.fit(new_X)
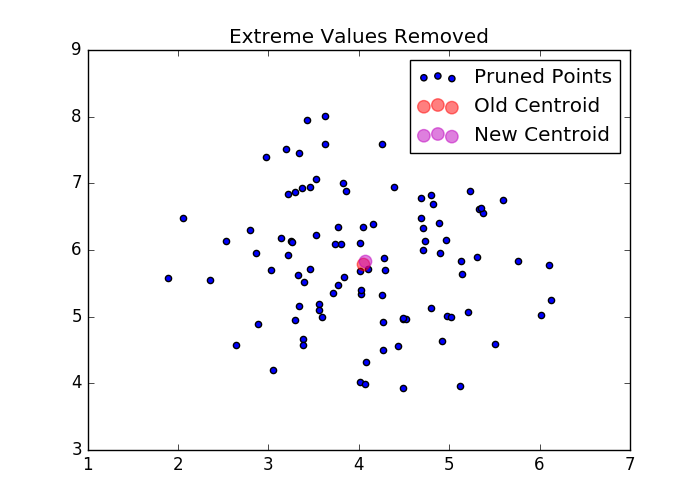
#Let's visualize the difference between the old and new centroids:
f, ax = plt.subplots(figsize=(7, 5))
ax.set_title("Extreme Values Removed")
ax.scatter(new_X[:, 0], new_X[:, 1], label='Pruned Points')
ax.scatter(kmeans.cluster_centers_[:, 0],kmeans.cluster_centers_[:, 1], label='Old Centroid',color='r', s=80, alpha=.5)
ax.scatter(new_kmeans.cluster_centers_[:, 0],new_kmeans.cluster_centers_[:, 1], label='New Centroid',color='m', s=80, alpha=.5)
ax.legend(loc='best')
f.show()

相关文章推荐
- IOS 字符串中去除特殊符号 stringByTrimmingCharactersInSet 应该用于账号登录等
- Linux Shell常用技巧(十一) 交互式使用shell
- Android View的几种背景颜色设置
- leetcode [python] 【206】Reverse Linked List
- 软考中高项学员:2016年3月9日作业
- 2017阿里内推实习生面试经历(已获得offer)
- 关于C与Java的输出代码
- 解决 IntelliJ 乱码问题
- Servlet------(声明式)异常处理
- O2O商业模式剖析
- POJ 3034 DP
- 55. Jump Game
- centos 7 中文输入法的安装和启用
- 剑指offer-面试题18:树的子结构
- ionic云开发系列一
- Linux Shell常用技巧(十) 管道组合
- ajax 跨域解决 网上资料
- Lua环境安装
- linux 下检查java jar包 程序是否正常 shell
- linux 下检查java jar包 程序是否正常 shell