Goaccess日志分析
2016-03-28 22:52
507 查看
最近网站部署了zabbix监控平台2.4但是还是感觉zabbix的日志分析还是有点美中不足,这里又接触到了goacces感觉这个开源工具使用非常爽,再次记录一下他的相关介绍以及使用方法
至于安装这里我们可以采用官方yum源进行安装,如果找不到的可以给我留言,到时候发给您。
我这里web服务器为nginx。
首先先来介绍一下goacces,他的功能主要有
统计概况,流量消耗等
访客排名
动态Web请求
静态web请求,如图片、样式表、脚本等。
来路域名
404 错误
操作系统
浏览器和搜索引擎
主机、DNS和ip地址
HTTP 响应代码
引荐网站
键盘布局
自定义显示
支持超大日志(分析速度很快)

GoAccess的基本语法如下:
goaccess [ -b ][ -s ][ -e IP_ADDRESS][ - a ] <-f log_file >
参数说明:
-f – 日志文件名
-b – 开启流量统计,如果希望加快分析速度不建议使用该参数
-s – 开启HTTP响应代码统计
-a – 开启用户代理统计
-e – 开启指定IP地址统计,默认禁用
-p -指定goacces用户配置文件路径
可以直接输入goaccess -f +日志路径 进入控制台,操作不多说,百度一大片。 IT网,http://www.it.net.cn
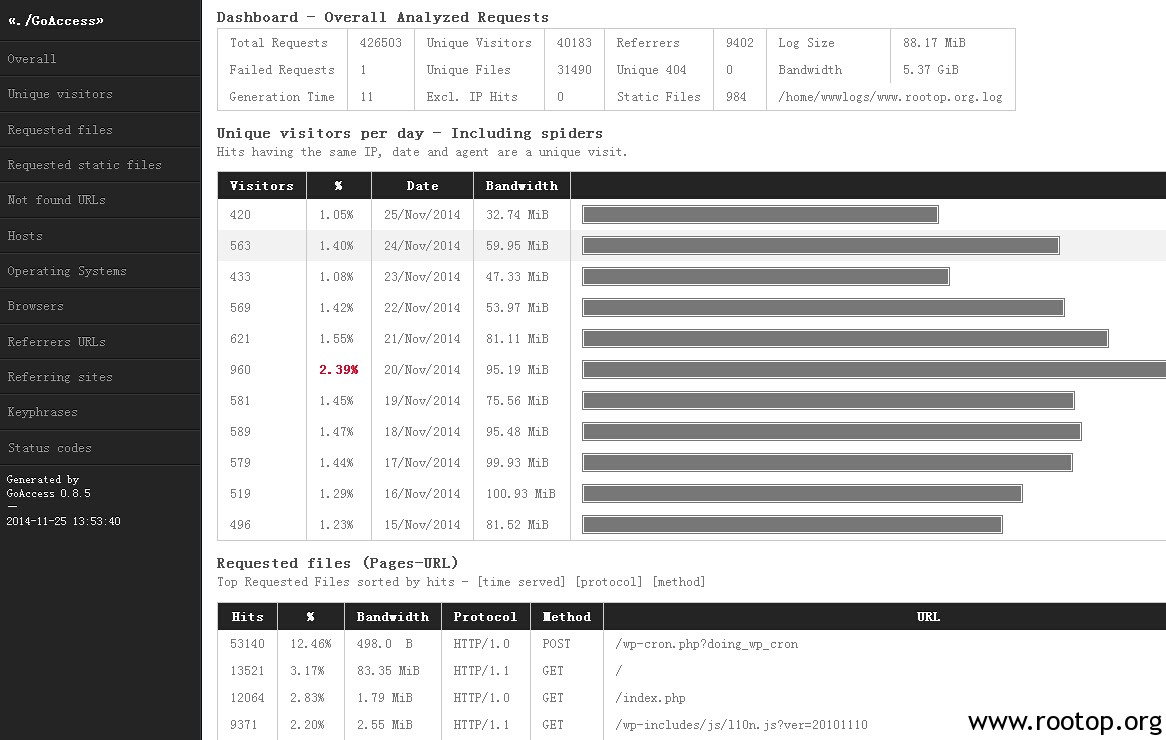
开始日志分析并导出为html文件:
也可以通过指定配置文件方式来分析。就不需要在命令中体现日志格式:
首先下载配置文件:
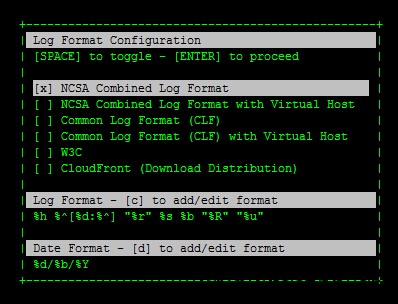
编辑.goaccess文件,把16和27行的前面注释去掉。(NCSA Combined Log Format)
date-format %d/%b/%Y
log-format %h %^[%d:%t %^] "%r" %s %b "%R" "%u"
time-format %H:%M:%S
T网,http://www.it.net.cn
[root@Rootop ~]# goaccess -f /home/wwwlogs/www.rootop.org.log -d -a -p ~/.goaccessrc > test2.html IT网,http://www.it.net.cn
需要注意这里的日志格式,每个nginx日志格式配置可能不同,goaccess指定的日志格式也不一定一样,需要对照下面的参数和nginx日志格式来指定命令中日志的格式。否则日志
分析的时候会报错。需要对nginx的日志格式有一定了解。 Linux学习,http:// linux.it.net.cn
goaccess时间和日志格式支持的参数:
date_format
The date_format variable followed by a space, specifies the log format date containing any combination of regular characters and special format specifiers. They all
begin with a percentage (%) sign. See http://linux.die.net/man/3/strftime
Note that there is no need to use time specifiers since they are not used by GoAccess. It’s recommended to use only date specifiers, i.e., %Y-%m-%d. IT网,http://www.it.net.cn
log_format
The log_format variable followed by a space or \t , specifies the log format string. Linux学习,http:// linux.it.net.cn
%d date field matching the date_format variable.
%h host (the client IP address, either IPv4 or IPv6) IT网,http://www.it.net.cn
%r The request line from the client. This requires specific delimiters around the request (as single quotes, double quotes, or anything else) to be parsable. If not, we
have to use a combination of special format specifiers as %m %U %H.
%m The request method.
%U The URL path requested (including any query string).
%H The request protocol.
%s The status code that the server sends back to the client. IT网,http://www.it.net.cn
%b The size of the object returned to the client.
%R The “Referrer” HTTP request header.
%u The user-agent HTTP request header. Linux学习,http:// linux.it.net.cn
%D The time taken to serve the request, in microseconds.
%T The time taken to serve the request, in seconds or milliseconds. Note: %D will take priority over %T if both are used.
%^ Ignore this field. Linux学习,http:// linux.it.net.cn
PS:
之前配置文件错误,分析nginx日志报错,经过求助软件作者解决,并对goaccess有更深入的了解。赞一下软件作者。
[root@Rootop ~]# goaccess -d -f /home/wwwlogs/www.rootop.org.log -a -p ~/.goaccesssrc > test.html
Parsing… [373,734] [373,734/s]
GoAccess – version 0.8.5 – Nov 20 2014 16:48:39
Fatal error has occurred
Error occured at: goaccess.c – main – 832
Nothing valid to process. IT网,http://www.it.net.cn
~/.goaccesssrc文件内容:
date_format %d/%b/%Y
log_format %^:%^ %h %^[%d:%^] “%r” %s %b
nginx日志:
58.251.136.61 – - [20/Nov/2014:17:29:21 +0800] “GET /wp-content/themes/g-white/js/all.js HTTP/1.1″200 1292 “http://www.rootop.org/pages/890.html”"Mozilla/5.0 (Windows NT 6.1; WOW64) AppleWebKit/537.36 (KHTML, like Gecko) Chrome/31.0.1650.63 Safari/537.36″ -
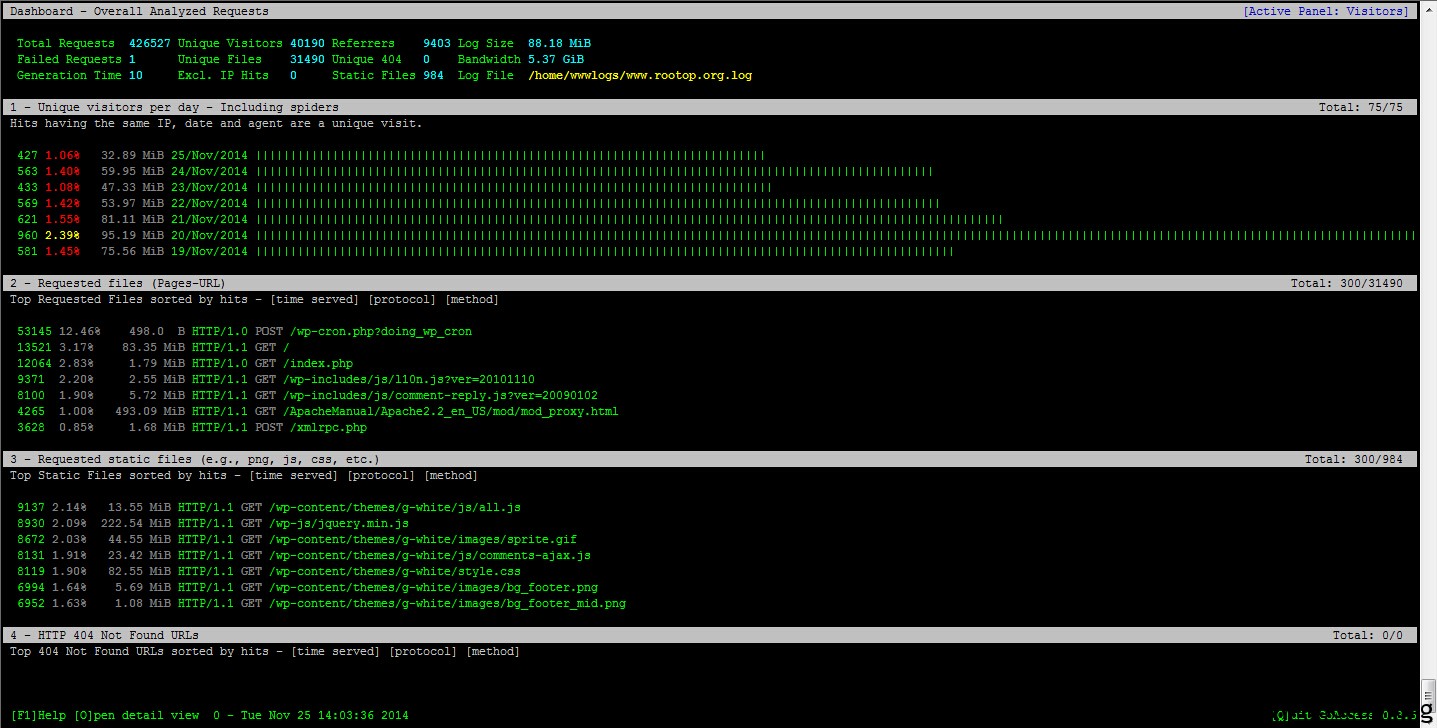
三,详解日志文件
你可以按向下的箭头滚动页面,你会发现以下区域,它们是按请求排序的。这里提及的目录顺序可能会根据你的发行版或者你所选的安装方式(从源和库)不同而不同:
1,每天唯一访客(来自同样IP、同一日期和同一浏览器的请求被认为是是唯一访问)
2,请求的文件(网页URL)
3,请求的静态文件(例如,.png文件,.js文件等等)
4,HTTP 404 未找到的响应代码
5,主机地址(客户端ip地址)
6,操作系统
7,浏览器
8,引荐网址
9,参考网站
,10,来自谷歌搜索引擎的前几位的关键字
11,HTTP 状态代码
至于安装这里我们可以采用官方yum源进行安装,如果找不到的可以给我留言,到时候发给您。
我这里web服务器为nginx。
首先先来介绍一下goacces,他的功能主要有
统计概况,流量消耗等
访客排名
动态Web请求
静态web请求,如图片、样式表、脚本等。
来路域名
404 错误
操作系统
浏览器和搜索引擎
主机、DNS和ip地址
HTTP 响应代码
引荐网站
键盘布局
自定义显示
支持超大日志(分析速度很快)
用法介绍
GoAccess的基本语法如下:goaccess [ -b ][ -s ][ -e IP_ADDRESS][ - a ] <-f log_file >
参数说明:
-f – 日志文件名
-b – 开启流量统计,如果希望加快分析速度不建议使用该参数
-s – 开启HTTP响应代码统计
-a – 开启用户代理统计
-e – 开启指定IP地址统计,默认禁用
-p -指定goacces用户配置文件路径
可以直接输入goaccess -f +日志路径 进入控制台,操作不多说,百度一大片。 IT网,http://www.it.net.cn
开始日志分析并导出为html文件:
| 1 | [root@Rootop ~]# goaccess -f /home/wwwlogs/www.rootop.org.log --log-format='%h %^[%d:%^] "%r" %s %b "%R" "%u"' --date-format='%d/%b/%Y' -d -a > test.html |
首先下载配置文件:
| 1 | [root@Rootop ~]# wget -O .goaccessrc https://raw.githubusercontent.com/allinurl/goaccess/master/config/goaccess.conf --no-check-certificate |
date-format %d/%b/%Y
log-format %h %^[%d:%t %^] "%r" %s %b "%R" "%u"
time-format %H:%M:%S
T网,http://www.it.net.cn
[root@Rootop ~]# goaccess -f /home/wwwlogs/www.rootop.org.log -d -a -p ~/.goaccessrc > test2.html IT网,http://www.it.net.cn
需要注意这里的日志格式,每个nginx日志格式配置可能不同,goaccess指定的日志格式也不一定一样,需要对照下面的参数和nginx日志格式来指定命令中日志的格式。否则日志
分析的时候会报错。需要对nginx的日志格式有一定了解。 Linux学习,http:// linux.it.net.cn
goaccess时间和日志格式支持的参数:
date_format
The date_format variable followed by a space, specifies the log format date containing any combination of regular characters and special format specifiers. They all
begin with a percentage (%) sign. See http://linux.die.net/man/3/strftime
Note that there is no need to use time specifiers since they are not used by GoAccess. It’s recommended to use only date specifiers, i.e., %Y-%m-%d. IT网,http://www.it.net.cn
log_format
The log_format variable followed by a space or \t , specifies the log format string. Linux学习,http:// linux.it.net.cn
%d date field matching the date_format variable.
%h host (the client IP address, either IPv4 or IPv6) IT网,http://www.it.net.cn
%r The request line from the client. This requires specific delimiters around the request (as single quotes, double quotes, or anything else) to be parsable. If not, we
have to use a combination of special format specifiers as %m %U %H.
%m The request method.
%U The URL path requested (including any query string).
%H The request protocol.
%s The status code that the server sends back to the client. IT网,http://www.it.net.cn
%b The size of the object returned to the client.
%R The “Referrer” HTTP request header.
%u The user-agent HTTP request header. Linux学习,http:// linux.it.net.cn
%D The time taken to serve the request, in microseconds.
%T The time taken to serve the request, in seconds or milliseconds. Note: %D will take priority over %T if both are used.
%^ Ignore this field. Linux学习,http:// linux.it.net.cn
PS:
之前配置文件错误,分析nginx日志报错,经过求助软件作者解决,并对goaccess有更深入的了解。赞一下软件作者。
[root@Rootop ~]# goaccess -d -f /home/wwwlogs/www.rootop.org.log -a -p ~/.goaccesssrc > test.html
Parsing… [373,734] [373,734/s]
GoAccess – version 0.8.5 – Nov 20 2014 16:48:39
Fatal error has occurred
Error occured at: goaccess.c – main – 832
Nothing valid to process. IT网,http://www.it.net.cn
~/.goaccesssrc文件内容:
date_format %d/%b/%Y
log_format %^:%^ %h %^[%d:%^] “%r” %s %b
nginx日志:
58.251.136.61 – - [20/Nov/2014:17:29:21 +0800] “GET /wp-content/themes/g-white/js/all.js HTTP/1.1″200 1292 “http://www.rootop.org/pages/890.html”"Mozilla/5.0 (Windows NT 6.1; WOW64) AppleWebKit/537.36 (KHTML, like Gecko) Chrome/31.0.1650.63 Safari/537.36″ -
三,详解日志文件
你可以按向下的箭头滚动页面,你会发现以下区域,它们是按请求排序的。这里提及的目录顺序可能会根据你的发行版或者你所选的安装方式(从源和库)不同而不同:
1,每天唯一访客(来自同样IP、同一日期和同一浏览器的请求被认为是是唯一访问)
<code>
1 - Unique visitors per day - Including spiders                                                                          Total: 5/5
Hits having the same IP, date and agent are a unique visit.

1 12.50%      0.0  B 14/May/2015 |||||||||||||||||||||||||||||||||||||||||||||||||
1 12.50%      0.0  B 13/May/2015 |||||||||||||||||||||||||||||||||||||||||||||||||
2 25.00%      0.0  B 12/May/2015 |||||||||||||||||||||||||||||||||||||||||||||||||||||||||||||||||||||||||||||||||||||||||||||||||||
2 25.00%      0.0  B 11/May/2015 |||||||||||||||||||||||||||||||||||||||||||||||||||||||||||||||||||||||||||||||||||||||||||||||||||
2 25.00%      0.0  B 10/May/2015 |||||||||||||||||||||||||||||||||||||||||||||||||||||||||||||||||||||||||||||||||||||||||||||||||||
</code>
2,请求的文件(网页URL)
<code>
2 - Requested files (Pages-URL)                                                                                        Total: 46/46
Top Requested Files sorted by hits - [time served] [protocol] [method]

70 13.18%      0.0  B HTTP/1.1 GET /
41 7.72%       0.0  B HTTP/1.1 GET /wp-content/themes/yusi1.0/style.css?ver=1.0
29 5.46%       0.0  B HTTP/1.1 GET /wp-content/themes/yusi1.0/timthumb.php?src=http://vbird.dic.ksu.edu.tw/linux_server/0110network_
27 5.08%       0.0  B HTTP/1.1 GET /wp-content/themes/yusi1.0/js/jquery.js?ver=1.0
25 4.71%       0.0  B HTTP/1.1 GET /wp-content/themes/yusi1.0/timthumb.php?src=http://192.168.2.101/wp-content/uploads/2015/04/dis
23 4.33%       0.0  B HTTP/1.1 GET /wp-content/themes/yusi1.0/timthumb.php?src=http://192.168.2.101/wp-content/themes/yusi1.0/img/pi
22 4.14%       0.0  B HTTP/1.1 GET /wp-content/themes/yusi1.0/timthumb.php?src=http://192.168.2.101/wp-content/themes/yusi1.0/img/pi
</code>
3,请求的静态文件(例如,.png文件,.js文件等等)
<code> 3 - Requested static files (e.g., png, js, css, etc.) Total: 7/7 Top Static Files sorted by hits - [time served] [protocol] [method] 4 0.75% 0.0 B HTTP/1.1 GET /wp-content/uploads/2015/04/disH4I-300x162.jpg 4 0.75% 0.0 B HTTP/1.1 GET /wp-content/themes/yusi1.0/js/html5.js 4 0.75% 0.0 B HTTP/1.1 GET /wp-content/uploads/2015/04/disH1I-300x162.jpg 4 0.75% 0.0 B HTTP/1.1 GET /wp-content/uploads/2015/04/disH2I-300x162.jpg 4 0.75% 0.0 B HTTP/1.1 GET /wp-content/themes/yusi1.0/share.css 3 0.56% 0.0 B HTTP/1.1 GET /wp-content/themes/yusi1.0/img/default.png 3 0.56% 0.0 B HTTP/1.1 GET /wp-content/uploads/2015/04/disH5I-300x162.jpg </code>
4,HTTP 404 未找到的响应代码
<code>
4 - HTTP 404 Not Found URLs                                                                                              Total: 5/5
Top 404 Not Found URLs sorted by hits - [time served] [protocol] [method]

14 2.64%      0.0  B HTTP/1.1 GET /
8  1.51%      0.0  B HTTP/1.1 GET /favicon.ico
6  1.13%      0.0  B HTTP/1.1 GET /forum.php
1  0.19%      0.0  B HTTP/1.1 GET /awstates/
1  0.19%      0.0  B HTTP/1.1 GET /awstates
</code>
5,主机地址(客户端ip地址)
<code>
5 - Hosts                                                                                                                Total: 8/8
Top Hosts sorted by hits - [bandwidth] [time served]

418 78.72%      0.0  B 192.168.2.168 |||||||||||||||||||||||||||||||||||||||||||||||||||||||||||||||||||||||||||||||||||||||||||||||
64  12.05%      0.0  B 192.168.2.119 ||||||||||||||
34  6.40%       0.0  B 192.168.2.101 |||||||
6   1.13%       0.0  B 192.168.0.210 |
5   0.94%       0.0  B 192.168.0.70  |
2   0.38%       0.0  B 192.168.0.71  |
1   0.19%       0.0  B 192.168.0.211 |
</code>
6,操作系统
<code>
6 - Operating Systems                                                                                                    Total: 1/1
Top Operating Systems sorted by unique visitors

8 100.00% Unknown ||||||||||||||||||||||||||||||||||||||||||||||||||||||||||||||||||||||||||||||||||||||||||||||||||||||||||||||||||
</code>
7,浏览器
<code>
7 - Browsers                                                                                                             Total: 1/1
Top Browsers sorted by unique visitors

8 100.00% Unknown ||||||||||||||||||||||||||||||||||||||||||||||||||||||||||||||||||||||||||||||||||||||||||||||||||||||||||||||||||
</code>
8,引荐网址
<code>
8 - Referrers URLs                                                                                                       Total: 0/0
Top Requested Referrers sorted by hits
</code>
9,参考网站
<code>
9 - Referring Sites                                                                                                      Total: 0/0
Top Referring Sites sorted by hits
</code>
,10,来自谷歌搜索引擎的前几位的关键字
<code>
10 - Keyphrases from Google's search engine                                                                              Total: 0/0
Top Keyphrases sorted by hits
</code>
11,HTTP 状态代码
<code>
11 - HTTP Status Codes                                                                                                   Total: 7/7
Top HTTP Status Codes sorted by hits

294 55.37% 4xx Client Error
123 23.16% 2xx Success
91  17.14% 3xx Redirection
23  4.33%  5xx Server Error
</code>

相关文章推荐
- pip install goose-extractor // SyntaxError: Missing parentheses in call to 'print'
- django的下载安装以及第一个项目的创建
- GO语言入门到精通(二)Golang编译器搭建
- MAC下Django环境搭建
- HDOJ 1056 HangOver(水题)
- HDOJ 1056 HangOver(水题)
- Gradient Descent Algorithm
- Intent的Category、Data、Type属性
- bzoj4377 Kurs szybkiego czytania 数学
- codeforces 653E. Bear and Forgotten Tree 2 连通问题
- Google的Protobuf协议分析
- Golang学习笔记:常见问题
- window.history back/go/forward/reload
- window.history.go(-1)和window.location.go(-1)的区别
- Django的一些优缺点评析
- django orm总结
- google glog
- PG 函数的易变性(Function Volatility Categories)
- 易景地球如何加载google等在线地图数据
- 使用Go语言工作400天后的感受