Debugging Frontend Applications
2016-03-25 14:32
337 查看
Debugging Frontend Applications
This document contains instructions and tips for debugging oVirt web applications built withGoogle Web Toolkit, an open source set of tools for building web applications using Java programming language. One GWT tool we'll use in particular is
Development Mode, which allows debugging GWT application without having to manually translate it to JavaScript.
This document assumes that you have
Engine development environment and
Java IDE configured accordingly.
Tip: Working Java IDE is required in order to debug GWT applications via Development Mode. This is due to
JPDA being used as the debugging protocol between IDE and Development Mode.
GWT Development Mode
Launching Development Mode spawns a separate JVM instance (Java application) that executes GWT application code as bytecode, providing a bridge between web browser and Java IDE:Java IDE connects to Development Mode to debug GWT application code, allowing to set breakpoints and debug code as if it was Java
browser connects to Development Mode via GWT Developer Plugin, passing instructions to Development Mode which executes them and sends the result back to browser
Following commands should be executed from within the Engine source directory, unless noted otherwise.
First, build Engine from source:
$ make clean install-dev PREFIX="$OVIRT_OUT" DEV_EXTRA_BUILD_FLAGS_GWT_DEFAULTS="-Dgwt.userAgent=$GWT_USER_AGENT" BUILD_GWT_WEBADMIN="1" BUILD_GWT_USERPORTAL="1" [extra makefile options if necessary]
OVIRT_OUTpoints to Engine build output directory
GWT_USER_AGENTspecifies web browser(s) for which to build GWT application(s), supported values:
ie8- Microsoft Internet Explorer 8 - UserPortal only, WebAdmin requires IE9+
ie9- Microsoft Internet Explorer 9 and above
gecko1_8- Mozilla Firefox
safari- Safari & Google Chrome
opera- Opera
Tip: Never use
ie6with
gwt.userAgent, Microsoft Internet Explorer 6 and 7 are
not supported by oVirt web applications.
Note that you can control GWT compilation using
BUILD_GWT_WEBADMINand
BUILD_GWT_USERPORTALflags. If such flag is set to
0then the corresponding application won't be available in Engine build. Since GWT compilation takes some time, make sure to disable GWT applications you're not debugging.
For example, to build Engine with WebAdmin (excluding UserPortal) for Firefox and Chrome browsers:
$ make clean install-dev PREFIX="$HOME/ovirt-engine" DEV_EXTRA_BUILD_FLAGS_GWT_DEFAULTS="-Dgwt.userAgent=gecko1_8,safari" BUILD_GWT_WEBADMIN="1" BUILD_GWT_USERPORTAL="0"
Tip: To avoid problems with GWT permutation selector script
*.nocache.jsbeing optimized-out, always build Engine for at least two browsers.
To start Development Mode, execute following commands:
$ make gwt-debug DEBUG_MODULE="$GWT_APP" DEV_EXTRA_BUILD_FLAGS_GWT_DEFAULTS="-Dgwt.userAgent=$GWT_USER_AGENT"
GWT_APPcan be one of following:
webadminfor debugging WebAdmin application
userportal-gwtpfor debugging UserPortal application
For example, to start Development Mode for debugging WebAdmin in Chrome browser:
$ make gwt-debug DEBUG_MODULE="webadmin" DEV_EXTRA_BUILD_FLAGS_GWT_DEFAULTS="-Dgwt.userAgent=safari"
Development Mode will inform you that it's awaiting debug connection from your Java IDE:
[INFO] Listening for transport dt_socket at address: 8000
In your Java IDE, create new "Remote Java Application" debug configuration for localhost:8000 with classpath that includes related frontend projects.
| IntelliJ Idea: "Run | Edit Configurations" |
On Configuration tab, set Host="localhost" and Port="8000"
| Eclipse: "Run | Debug Configurations" |
On Connect tab, set Host="localhost" and Port="8000"
| On Source tab, click "Add | Java Project" and choose related frontend projects |
Start a web browser (the one you've specified earlier through
GWT_USER_AGENT) and navigate to GWT application's debug URL:
WebAdmin: http://127.0.0.1:8080/ovirt-engine/webadmin/WebAdmin.html?gwt.codesvr=127.0.0.1:9997 UserPortal: http://127.0.0.1:8080/ovirt-engine/userportal/UserPortal.html?gwt.codesvr=127.0.0.1:9997
Tip: GWT application's debug URL contains the suffix
?gwt.codesvr=127.0.0.1:9997which tells GWT Developer Plugin to connect to Development Mode at
127.0.0.1:9997.
If you open the debug URL for the first time, you will be prompted to install GWT Developer Plugin for the given web browser. Just proceed with plugin installation and restart the browser.
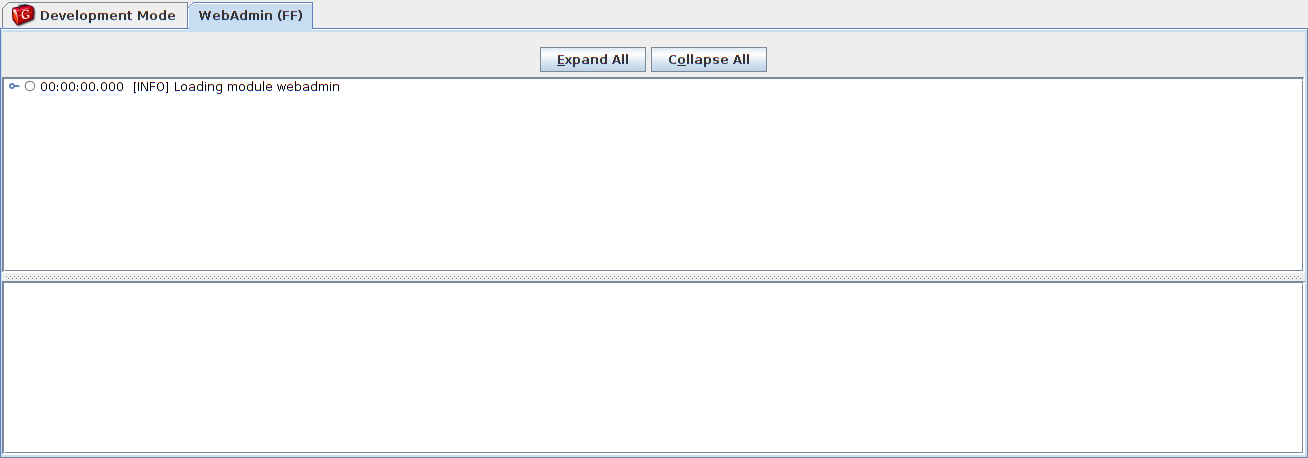
Next time you open the debug URL, GWT Developer Plugin will connect to Development Mode and new debugging session will be started for the given browser. This can take some time, please be patient and wait while the application gets loaded.
GWT Development Cycle
Change frontend application's code while Development Mode is running, your IDE might prompt you to restart debug connection (i.e. hot swap failed) - just reconnect again.Reload (refresh) GWT application in your browser in order for your changes to take effect.
GWT Draft Compile
Sometimes it's necessary to profile or analyze GWT applications, e.g. fixing memory leaks or identifying performance bottlenecks in different web browsers. GWT compiler produces optimized and obfuscated JavaScript and CSS by default, which is hard to workwith.
To compile oVirt web applications in draft mode, use
DEV_BUILD_GWT_DRAFTmakefile option:
$ make clean install-dev [usual makefile options] DEV_BUILD_GWT_DRAFT="1"
Tip: Do not use draft mode for regular Engine builds.
Compiling GWT application in draft mode has following effects:
prevent code obfuscation (useful when analyzing cause of runtime errors or other JavaScript issues)
prevent CSS class name obfuscation (useful when correlating CSS rules with HTML elements)
reduce the level of code optimizations (this maps to GWT compiler's
draftCompileoption)
Frequently asked questions
Q: My web browser doesn't prompt me to install GWT Developer Plugin.A: Make sure your browser is officially supported by GWT Developer Plugin. Alternatively, get it from
here and install the plugin manually into your browser.
Q: The web page is blank after navigating to debug URL.
A: Make sure to build Engine from source prior to debugging for at least two different browsers.
Q: Client-side logs are not persisted on Engine, e.g.
$JBOSS_HOME/standalone/log/engine/engine-ui.log.
A: At the moment, client-side logging works only when debugging GWT application via Development Mode. In future, we might consider adding infrastructure to support persisting client-side logs on server.
Q: I'm getting
-bindAddress host "0.0.0.0" unknownerror message when launching Development Mode.
A: Using 0.0.0.0 means that Development Mode will listen for incoming connections on all network interfaces, as opposed to 127.0.0.1 which listens for incoming connections only on loopback interface available from local machine only. Make sure that host
name is properly set in
/etc/hosts. For Windows machines, check
%windir%\system32\drivers\etc\hosts.
Q: I'm getting
Exception: java.lang.OutOfMemoryErroror similar error during GWT compilation.
A: You can tweak GWT compiler's JVM arguments using
DEV_EXTRA_BUILD_FLAGSmakefile option, for example:
$ make clean install-dev [usual makefile options] DEV_EXTRA_BUILD_FLAGS="-Dgwt-plugin.extraJvmArgs="-Xms1024M -Xmx2048M -XX:PermSize=256M -XX:MaxPermSize=512M""

相关文章推荐
- iOS之Photos:访问某个相册通过collectionView显示
- iOS一句话搞定图片上传,数据请求(基于AFN)[持续更新]
- 初涉Android Studio从官方文档开始(2)
- Android开发中的小技巧
- iOS学习之路(一)--开篇:学习纲领
- HBuilder开发App教程
- Android 工具类积累
- Android 自定义WheelView
- swift之向ftp服务器传文件
- [Android分享] 通过蓝牙,在两台设备之间传递音频(包括音乐,通话)
- Android开发优化建议
- Android 动画机制 之 属性动画
- android的消息处理机制(图+源码分析)——Looper,Handler,Message
- Android系统性能优化备忘
- Android程序中输入法弹出的时候如何不遮挡输入,与布局相配
- Cocos2d-js Chipmunk的使用,实现一根绳子
- iOS完整App资源收集
- Github上的600多个iOS开源类库
- Android WebView开发问题及优化汇总
- iOS 项目的目录结构能看出你的开发经验