(5)Jfreechart环形图
2016-03-04 15:05
204 查看
1、环形效果图
2、详解
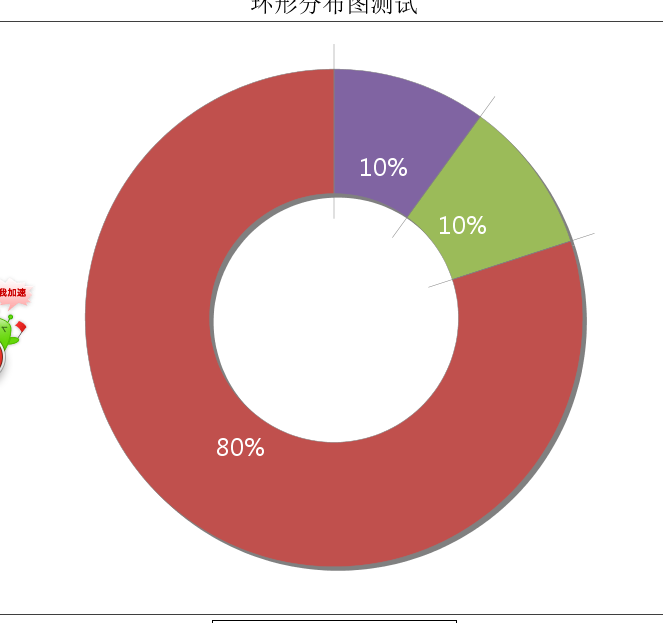
通过createRingChart创建环形图JFreeChart chart5 = ChartFactory.createRingChart(“环形分布图测试”,
getPieOrRingChartDataSet(), true, true, Locale.CHINESE);
设置样式
chart.setBackgroundPaint(Color.white);
RingPlot ringplot = (RingPlot) chart.getPlot();
ringplot.setLabelBackgroundPaint(Color.WHITE);
//设置环形图的每个扇区的样式
ringplot.setSectionPaint(0, new Color(128, 100, 162));
ringplot.setSectionPaint(1, new Color(155, 187, 89));
ringplot.setSectionPaint(2, new Color(192, 80, 77));
// ringplot.setLabelLinksVisible(false);
// 设置饼状图和环形图的显示数字。0代表显示文字说明,1代表显示数字,2代表显示数字以百分比的方式如果多个结合{0}:{1}
ringplot.setLabelGenerator(new StandardPieSectionLabelGenerator(“{2}”));
ringplot.setSimpleLabels(true);
ringplot.setLabelBackgroundPaint(new Color(1.0F, 0.75F, 0.0F, 0.0F));
ringplot.setLabelFont(new Font(“sans-serif”, Font.PLAIN, 12));
ringplot.setLabelOutlinePaint(new Color(1.0F, 0.75F, 0.0F, 0.0F));
ringplot.setLabelPaint(Color.white);
ringplot.setLabelFont(new Font(“微软雅黑”, Font.PLAIN, 24));
ringplot.setLabelShadowPaint(new Color(1.0F, 0.75F, 0.0F, 0.0F));
TextTitle title = chart.getTitle();
title.setFont(new Font(“sans-serif”, Font.PLAIN, 24));
// 设置深度,即带颜色圆环的宽度
ringplot.setSectionDepth(0.5d);
// 设置环形图背景颜色
ringplot.setBackgroundPaint(Color.white);
设置数据集
private static PieDataset getPieOrRingChartDataSet() {
DefaultPieDataset dataset = new DefaultPieDataset();
dataset.setValue(“2.0分-3.0分”, new Double(10));
dataset.setValue(“3.0分-4.0分”, new Double(10));
dataset.setValue(“4.0分-5.0分”, new Double(80));
return dataset;
}
在main方法中执行
ChartFrame pieFrame = new ChartFrame(“水果销量分布图”, createRingChart2());
pieFrame.pack(); pieFrame.setVisible(true);
案例
package com.lizj_cdoc.jfreechartUtil;import java.awt.Color;
import java.awt.Font;
import java.util.Locale;
import org.jfree.chart.ChartFactory;
import org.jfree.chart.ChartFrame;
import org.jfree.chart.JFreeChart;
import org.jfree.chart.labels.StandardPieSectionLabelGenerator;
import org.jfree.chart.plot.RingPlot;
import org.jfree.chart.title.TextTitle;
import org.jfree.data.general.DefaultPieDataset;
import org.jfree.data.general.PieDataset;
public class CreateRingChart {
public static void main(String[] args) {
final ChartFrame frame = new ChartFrame(“Interval Bar Chart Demo”, createRingChart());
frame.pack();
frame.setVisible(true);
}
public static JFreeChart createRingChart() {
JFreeChart chart5 = ChartFactory.createRingChart(“环形分布图测试”,
getPieOrRingChartDataSet(), true, true, Locale.CHINESE);
setRingChart(chart5);
return chart5;
}
public static void setRingChart(JFreeChart chart) {
chart.setBackgroundPaint(Color.white);
RingPlot ringplot = (RingPlot) chart.getPlot();
ringplot.setLabelBackgroundPaint(Color.WHITE);
ringplot.setSectionPaint(0, new Color(128, 100, 162));
ringplot.setSectionPaint(1, new Color(155, 187, 89));
ringplot.setSectionPaint(2, new Color(192, 80, 77));
// ringplot.setLabelLinksVisible(false);
// 设置饼状图和环形图的显示数字。0代表显示文字说明,1代表显示数字,2代表显示数字以百分比的方式如果多个结合{0}:{1}
ringplot.setLabelGenerator(new StandardPieSectionLabelGenerator(“{2}”));
ringplot.setSimpleLabels(true);
ringplot.setLabelBackgroundPaint(new Color(1.0F, 0.75F, 0.0F, 0.0F));
ringplot.setLabelFont(new Font(“sans-serif”, Font.PLAIN, 12));
ringplot.setLabelOutlinePaint(new Color(1.0F, 0.75F, 0.0F, 0.0F));
ringplot.setLabelPaint(Color.white);
ringplot.setLabelFont(new Font(“微软雅黑”, Font.PLAIN, 24));
ringplot.setLabelShadowPaint(new Color(1.0F, 0.75F, 0.0F, 0.0F));
TextTitle title = chart.getTitle();
title.setFont(new Font(“sans-serif”, Font.PLAIN, 24));
// 设置深度,即带颜色圆环的宽度
ringplot.setSectionDepth(0.5d);
// 设置环形图背景颜色
ringplot.setBackgroundPaint(Color.white);
chart.getLegend().setItemFont(new Font("微软雅黑", Font.BOLD, 12));
}
private static PieDataset getPieOrRingChartDataSet() {
DefaultPieDataset dataset = new DefaultPieDataset();
/* dataset.setValue("1.0分-2.0分", new Double(0)); */
dataset.setValue("2.0分-3.0分", new Double(10));
dataset.setValue("3.0分-4.0分", new Double(10));
dataset.setValue("4.0分-5.0分", new Double(80));

return dataset;
}
}
这里写代码片

相关文章推荐
- jfreechart插件将数据展示成饼状图、柱状图和折线图
- opensuse下如何解决jfreechart中文乱码的问题
- jsp JFreeChart使用心得与例子
- java类中生成jfreechart,返回图表的url地址 代码分享
- java类中使用Jfreechart的简单实例
- java生成饼图svg及JFreeChart生成svg图表
- JFreeChart系列教程
- Jfreechart绘制漂亮的图表
- Jfreechart中文API和属性详解
- 使用jfreechart导致JSP页面汉字出现乱码
- JFreeChart部分中文API
- JFreeChart图形报表
- 试用jfreechart1.0.9和BIRT2.1.1后不该忘记的
- jfreechart的饼图对应的每块都是有值注释显示的,柱图和线图如何在柱子或点旁边这个柱子或这个点的值呢?
- jfreechart的线性图是所有的点的连接,线是连续的。如何实现间断的线性图呢?即一条线,当满足某个条件:如值为零时,线在此中断,只连接相邻的不为零的点。
- 好的学习站点
- JFreeChart乱码解决方法
- JFreeChart Examples
- Linux(Slackware)下配置jdk1.5中文字体
- 使用Jasperreport作为报表控件开发Web 报表应用