Windows上怎么安装ELK
2016-01-20 18:10
721 查看
In this guide I will show that it is also possible to run Logstash on a Windows Server 2012 machine and use IIS as web server. This guide probably requires some improvements and optimizations but it should give you a good example of how to set everything up.
Please, be aware that you will probably have to configure Kibana in a different way then I did to make everything look shiny, and you will probably have to use a different kind of logstash configuration to make things show as you would like. I am also aware that Logstash provides all-in-one pages that have ElasticSearch and Kibana built in, however I still feel setting things up separately is more appropriate.
The config below is just meant to be an example to show that everything works just as fine on Windows as it does on Linux.
If you are interested in Linux then please have a look at my other guide at: http://blog.basefarm.com/blog/how-to-install-logstash-with-kibana-interface-on-rhel/
Now lets start with the guide!
Step 1: Download Logstash, Kibana and ElasticSearch.
Simpely go to “http://www.elasticsearch.org/overview/elkdownloads/”
Logstash: https://download.elasticsearch.org/logstash/logstash/logstash-1.4.2.zip
Kibana: https://download.elasticsearch.org/kibana/kibana/kibana-3.1.0.zip
Elasticsearch: https://download.elasticsearch.org/elasticsearch/elasticsearch/elasticsearch-1.2.1.zip
Step 2: Extract all packages
I created myself a folder called “basefarm” in “c:\basefarm\” and extracted all folders there to make it easier.
So, for me it looks like this now:
c:\basefarm\elasticsearch
c:\basefarm\kibana
c:\basefarm\logstash
Step 3: Download the JDK version of Java and install it.
Go to the Java website: http://www.oracle.com/technetwork/java/javase/downloads/jdk8-downloads-2133151.html
Accept the license and then download: “Windows x64 (jdk-8u5-windows-x64.exe)” package.
Now install it!
Step 4: Add the JAVA_HOME variable to the server
Now right click on “This PC” and choose “Properties” on the right bottom site next to your computer and full computer name click on Change settings.
On the window that opens go to the Advanced tab and click on “Environment Variables”.
at the bottom box called “System Variables” click on “new” and add the following:
Variable Name: JAVA_HOME
Variable value: C:\Program Files\Java\jdk1.8.0_05
It should look like this:

Step 5: Download the required configuration files
Logstash.conf:https://github.com/sbagmeijer/ulyaoth/blob/master/guides/logstash/windows/logstash.conf
Place this file in:
C:\basefarm\logstash\bin
ulyaoth.json:
https://raw.githubusercontent.com/sbagmeijer/ulyaoth/master/guides/logstash/kibana/dashboard/ulyaoth.json
Place this file in:
C:\basefarm\kibana\app\dashboards
rename “ulyaoth.json” to “basefarm.json” so you end up with “C:\basefarm\kibana\app\dashboards\basefarm.json”.
Step 6: Configure Kibana & Logstash
Open the file: C:\basefarm\kibana\config.js
and change the following line:
default_route : ‘/dashboard/file/default.json’,
to:
default_route : ‘/dashboard/file/basefarm.json’,
Now open the file: C:\basefarm\kibana\app\dashboards\basefarm.json
and change the following line:
“title”: “Ulyaoth: Logstash Search”,
to:
“title”: “Basefarm: Logstash Search”,
Step 7: Install IIS
Go to “Server Manager” and choose “Add Roles and Features Wizard” from the list here choose “Web Server (IIS)” now go further and let it install.
Step 8: Open IIS Manager and stop the “Default Web Site”
Just press the stop button like you see below in the picture:

Step 9: Create a new website for Kibana as shown below
Right click on “sites” in the left part of IIS Manager and click “Add Website”.
Fill it in something like this:

It should automatically start.
Step 10: Start Elasticsearch and put it on auto-start
Open a console and go to “c:\basefarm\elasticsearch\bin\”
now type the following command:
You should see something like:

Now type the following:
You should see the elasticsearch service manager:

You have to change on the tab the “Startup type” from Manual to Automatic and then press “Apply”. This should make Elasticsearch start automatically on server boot.
This window contains some more options such as how much memory Elasticsearch will use. You can find this under the “Java” tab. I would suggest to make this fitfor your server if you have a server that will handle a huge amount of logs. I would increase the “Maximum Memory Pool: 1024” at least to a higher amount.
Before you close the window make sure to press “Start” so it actually will run right now

This is everything to start ElasticSearch automatically on boot. To test that it is working, open a browser and go to this url: http://127.0.0.1:9200/
If you see a json string something like what you see below in the picture then it means it is running:

Step 11: Start Logstash & Autostart it
For this step we need another small program to create a proper Windows service, so please go ahead and download “NSSM” (the Non-Sucking Service Manager) from: http://nssm.cc/
Once you have the zip file simply unzip it and copy the file from the unzipped folder you now have: “nssm-2.23\win64” (nssm.exe) to “C:\basefarm\logstash\bin” so it should result in you having “C:\basefarm\logstash\bin\nssm.exe”.
I know you technically do not have to copy this file but just to keep things clean and to have this available for any future use you never know.
Now open a Command Prompt and type:
And then type the following:
You will now see a GUI to create a server fill in the following:
Path: C:\basefarm\logstash\bin\logstash.bat
Startup directory: C:\basefarm\logstash\bin
Arguments: agent -f C:/basefarm/logstash/bin/logstash.conf
It should look like this:

If all looks okay double check on the “Details” tab that “Startup Type” is set to “Automatic” and then press “Install service”. This should be all for Logstash to automatically start on server boot.
If you wish to adjust the memory Logstash does use then simpely open the file “C:\basefarm\logstash\bin\logstash.bat” and the change the following two lines accordingly to the amount of memory you wish it to use:
Step 12: Edit your host file (optional)
This step I only do because I run everything on a test server with no internet connection.
open: C:\Windows\System32\drivers\etc\hosts
Now add:
127.0.0.1 loghost.basefarm.com
And save the file.
Now reboot your server so you can test that everything is automatically coming online.
This is all you should have to do once the server is back online you have logstash up and running so just go to: http://loghost.basefarm.com/
And you should see:

As you can see, your Kibana IIS logs are shipped now to the Logstash instance.
Just remember, if you run this website over the internet you probably need to make sure port 9200 is accessible but I would restrict it to internal use only so Kibana can reach it but not the outside world.
If you want to ship logs from another server to your loghost server I would suggest to have a look into a program called “nxlog” (http://nxlog-ce.sourceforge.net/) this is a fairly simple way of shipping logs to Lgstash and works perfect on Wndows.
If you have any suggestions to improve this guide then please feel free to or update the configs on GitHub or to provide me the information so I can update the guide and help others!
I also would like to thank “Milo Bofacher” for pointing to “nssm” and “nxlog”!
I won’t go into the detail which this blog has done, so expect some short, sweet bullet points. Then we’ll create some visualizations (pretty pictures) from the basic IIS logs, which could help identify problems with your web application.
elasticsearch - store and search large amount of structured, unstructured and time-series data.
Kibana - visualize your data from elasticsearch.
Grab it from Oracle’s website if you need it.
Follow instructions on this Stack Overflow answer if you’re not sure how to add Java to your path. You’ll want to add:
Variable:
Value:
Download:
logstash
elasticsearch
Kibana
Extract each zip to a common folder (I’ve called mine “monitoring”). You should end up with something like:
…and push it to elasticsearch in a structured manner. There’s a few ways to extract this information. In this example, it’s being done by matching the order which the terms appear. It’s important to specify the types here to have full searching power later on. You don’t want everything being a
To strip out the detail and specify types, we’ll need to tell logstash how to interpret it. Introducing grok, which works by combining text patterns into something that matches your logs. There are currently over 120 patterns to match against.
So, here is our grok filter, which is added to the logstash config.
You’ll note the first part of the filter is
Below is a full config file which you can use for the standard IIS log format. It will extract the values as explained above and push them to elasticsearch. Copy the config (and amend it to your needs) to a new file and name it
Now all we need to do is start the logstash process and it will monitor any location(s) specified in the inputsection of the config.
[/code]
Now, once elasticsearch is running, any new log lines will now be pushed there in a nice format!
As a one off, you’ll need to run the install command.
To start the elasticsearch process, simply execute the following:
That’s it! elasticsearch should now be running at
If you need to stop the process, simply execute:
If you need any more information you can check out the official docs on the elastic website.
[/code]
That’s it! There is a config file in the bin directory, but the defaults should suffice for now. Kibana should availble at
You’ll need to have a few logs in elasticsearch to complete the Kibana setup. When you first open Kibana you’ll be taken to a settings page titled “Configure an index pattern”. Check the checkbox “Use event times to create index names”. As we’re using elasticsearch, the defaults should be fine and you should be able to click “Create”.
Some examples below. You can see the filter criteria I have used in the left pane.

Can’t find your terms? They’re probably cached by Kibana.
Click “Settings”
Select your index
Click “Reload field list” (the yellow button)
Please, be aware that you will probably have to configure Kibana in a different way then I did to make everything look shiny, and you will probably have to use a different kind of logstash configuration to make things show as you would like. I am also aware that Logstash provides all-in-one pages that have ElasticSearch and Kibana built in, however I still feel setting things up separately is more appropriate.
The config below is just meant to be an example to show that everything works just as fine on Windows as it does on Linux.
If you are interested in Linux then please have a look at my other guide at: http://blog.basefarm.com/blog/how-to-install-logstash-with-kibana-interface-on-rhel/
Now lets start with the guide!
Step 1: Download Logstash, Kibana and ElasticSearch.
Simpely go to “http://www.elasticsearch.org/overview/elkdownloads/”
Logstash: https://download.elasticsearch.org/logstash/logstash/logstash-1.4.2.zip
Kibana: https://download.elasticsearch.org/kibana/kibana/kibana-3.1.0.zip
Elasticsearch: https://download.elasticsearch.org/elasticsearch/elasticsearch/elasticsearch-1.2.1.zip
Step 2: Extract all packages
I created myself a folder called “basefarm” in “c:\basefarm\” and extracted all folders there to make it easier.
So, for me it looks like this now:
c:\basefarm\elasticsearch
c:\basefarm\kibana
c:\basefarm\logstash
Step 3: Download the JDK version of Java and install it.
Go to the Java website: http://www.oracle.com/technetwork/java/javase/downloads/jdk8-downloads-2133151.html
Accept the license and then download: “Windows x64 (jdk-8u5-windows-x64.exe)” package.
Now install it!
Step 4: Add the JAVA_HOME variable to the server
Now right click on “This PC” and choose “Properties” on the right bottom site next to your computer and full computer name click on Change settings.
On the window that opens go to the Advanced tab and click on “Environment Variables”.
at the bottom box called “System Variables” click on “new” and add the following:
Variable Name: JAVA_HOME
Variable value: C:\Program Files\Java\jdk1.8.0_05
It should look like this:
Step 5: Download the required configuration files
Logstash.conf:https://github.com/sbagmeijer/ulyaoth/blob/master/guides/logstash/windows/logstash.conf
Place this file in:
C:\basefarm\logstash\bin
ulyaoth.json:
https://raw.githubusercontent.com/sbagmeijer/ulyaoth/master/guides/logstash/kibana/dashboard/ulyaoth.json
Place this file in:
C:\basefarm\kibana\app\dashboards
rename “ulyaoth.json” to “basefarm.json” so you end up with “C:\basefarm\kibana\app\dashboards\basefarm.json”.
Step 6: Configure Kibana & Logstash
Open the file: C:\basefarm\kibana\config.js
and change the following line:
default_route : ‘/dashboard/file/default.json’,
to:
default_route : ‘/dashboard/file/basefarm.json’,
Now open the file: C:\basefarm\kibana\app\dashboards\basefarm.json
and change the following line:
“title”: “Ulyaoth: Logstash Search”,
to:
“title”: “Basefarm: Logstash Search”,
Step 7: Install IIS
Go to “Server Manager” and choose “Add Roles and Features Wizard” from the list here choose “Web Server (IIS)” now go further and let it install.
Step 8: Open IIS Manager and stop the “Default Web Site”
Just press the stop button like you see below in the picture:
Step 9: Create a new website for Kibana as shown below
Right click on “sites” in the left part of IIS Manager and click “Add Website”.
Fill it in something like this:
It should automatically start.
Step 10: Start Elasticsearch and put it on auto-start
Open a console and go to “c:\basefarm\elasticsearch\bin\”
now type the following command:
service install
You should see something like:
Now type the following:
service manager
You should see the elasticsearch service manager:
You have to change on the tab the “Startup type” from Manual to Automatic and then press “Apply”. This should make Elasticsearch start automatically on server boot.
This window contains some more options such as how much memory Elasticsearch will use. You can find this under the “Java” tab. I would suggest to make this fitfor your server if you have a server that will handle a huge amount of logs. I would increase the “Maximum Memory Pool: 1024” at least to a higher amount.
Before you close the window make sure to press “Start” so it actually will run right now
This is everything to start ElasticSearch automatically on boot. To test that it is working, open a browser and go to this url: http://127.0.0.1:9200/
If you see a json string something like what you see below in the picture then it means it is running:
Step 11: Start Logstash & Autostart it
For this step we need another small program to create a proper Windows service, so please go ahead and download “NSSM” (the Non-Sucking Service Manager) from: http://nssm.cc/
http://nssm.cc/release/nssm-2.23.zip
Once you have the zip file simply unzip it and copy the file from the unzipped folder you now have: “nssm-2.23\win64” (nssm.exe) to “C:\basefarm\logstash\bin” so it should result in you having “C:\basefarm\logstash\bin\nssm.exe”.
I know you technically do not have to copy this file but just to keep things clean and to have this available for any future use you never know.
Now open a Command Prompt and type:
cd C:\basefarm\logstash\bin
And then type the following:
nssm install logstash
You will now see a GUI to create a server fill in the following:
Path: C:\basefarm\logstash\bin\logstash.bat
Startup directory: C:\basefarm\logstash\bin
Arguments: agent -f C:/basefarm/logstash/bin/logstash.conf
It should look like this:
If all looks okay double check on the “Details” tab that “Startup Type” is set to “Automatic” and then press “Install service”. This should be all for Logstash to automatically start on server boot.
If you wish to adjust the memory Logstash does use then simpely open the file “C:\basefarm\logstash\bin\logstash.bat” and the change the following two lines accordingly to the amount of memory you wish it to use:
set LS_MIN_MEM=256m
set LS_MAX_MEM=1g
Step 12: Edit your host file (optional)
This step I only do because I run everything on a test server with no internet connection.
open: C:\Windows\System32\drivers\etc\hosts
Now add:
127.0.0.1 loghost.basefarm.com
And save the file.
Now reboot your server so you can test that everything is automatically coming online.
This is all you should have to do once the server is back online you have logstash up and running so just go to: http://loghost.basefarm.com/
And you should see:
As you can see, your Kibana IIS logs are shipped now to the Logstash instance.
Just remember, if you run this website over the internet you probably need to make sure port 9200 is accessible but I would restrict it to internal use only so Kibana can reach it but not the outside world.
If you want to ship logs from another server to your loghost server I would suggest to have a look into a program called “nxlog” (http://nxlog-ce.sourceforge.net/) this is a fairly simple way of shipping logs to Lgstash and works perfect on Wndows.
If you have any suggestions to improve this guide then please feel free to or update the configs on GitHub or to provide me the information so I can update the guide and help others!
I also would like to thank “Milo Bofacher” for pointing to “nssm” and “nxlog”!
Intro
This is a quick run-through of configuring logstash, elasticsearch and Kibana (the ELK stack) on Windows to create a real time monitoring solution for your web application. It took me around 2 hours to get this setup the first time while following this excellent blog.I won’t go into the detail which this blog has done, so expect some short, sweet bullet points. Then we’ll create some visualizations (pretty pictures) from the basic IIS logs, which could help identify problems with your web application.
Summary of tools
logstash - used to process unstructured data (e.g. logs) from various sources into structured, readable keys and values which will be pushed to elasticsearch where they can later be queried. Simply tell logstash where your logs are, how to transform the unstructured data into something structured and where your elasticsearch instance is running. The structured output will be forwarded to elasticsearch.elasticsearch - store and search large amount of structured, unstructured and time-series data.
Kibana - visualize your data from elasticsearch.
Prerequisites
Java. It’s required for logash. It also must be on your path.Grab it from Oracle’s website if you need it.
Follow instructions on this Stack Overflow answer if you’re not sure how to add Java to your path. You’ll want to add:
Variable:
JAVA_HOME
Value:
C:\Program Files\Java\jdk1.8.0_45
Setup
Head over to https://www.elastic.co/downloads.Download:
logstash
elasticsearch
Kibana
Extract each zip to a common folder (I’ve called mine “monitoring”). You should end up with something like:
C:\monitoring\logstash
C:\monitoring\elasticsearch
C:\monitoring\kibana
logstash
First, some explanation. We want to take a standard log line from a web application running on IIS, which looks like…2015-07-09 09:21:32 ::1 POST /WebApplication/Claims/1 - 80 - ::1 Mozilla/5.0+(Windows+NT+6.1;+WOW64)+AppleWebKit/537.36+(KHTML,+like+Gecko)+Chrome/43.0.2357.132+Safari/537.36 200 0 0 84
…and push it to elasticsearch in a structured manner. There’s a few ways to extract this information. In this example, it’s being done by matching the order which the terms appear. It’s important to specify the types here to have full searching power later on. You don’t want everything being a
string!
To strip out the detail and specify types, we’ll need to tell logstash how to interpret it. Introducing grok, which works by combining text patterns into something that matches your logs. There are currently over 120 patterns to match against.
So, here is our grok filter, which is added to the logstash config.
match => ["message", "%{TIMESTAMP_ISO8601:log_timestamp} %{IPORHOST:site} %{WORD:http_method} %{URIPATH:page} %{NOTSPACE:query_string} %{NUMBER:port} %{NOTSPACE:username} %{IPORHOST:client_host} %{NOTSPACE:useragent} %{NUMBER:http_response} %{NUMBER:sub_response} %{NUMBER:sc_status} %{NUMBER:time_taken}"]You’ll note the first part of the filter is
{TIMESTAMP_ISO8601:log_timestamp} which is simply stating the type followed by a term to identity the matched value by. When you look back at the example log line, you’ll see the first value is 2015-07-09 09:21:32which is a timestamp. Simples!
Below is a full config file which you can use for the standard IIS log format. It will extract the values as explained above and push them to elasticsearch. Copy the config (and amend it to your needs) to a new file and name it
logstash.conf. Save it to your logstash bin folder
C:\monitoring\logstash\bin.
input {
file {
type => "IISLog"
path => "C:/inetpub/logs/LogFiles/W3SVC*/*.log"
start_position => "beginning"
}
}

filter {

# ignore log comments
if [message] =~ "^#" {
drop {}
}

# check that fields match your IIS log settings
grok {
match => ["message", "%{TIMESTAMP_ISO8601:log_timestamp} %{IPORHOST:site} %{WORD:http_method} %{URIPATH:page} %{NOTSPACE:query_string} %{NUMBER:port} %{NOTSPACE:username} %{IPORHOST:client_host} %{NOTSPACE:useragent} %{NUMBER:http_response} %{NUMBER:sub_response} %{NUMBER:sc_status} %{NUMBER:time_taken}"]
}

# set the event timestamp from the log
# https://www.elastic.co/guide/en/logstash/current/plugins-filters-date.html date {
match => [ "log_timestamp", "YYYY-MM-dd HH:mm:ss" ]
timezone => "Etc/UCT"
}

# matches the big, long nasty useragent string to the actual browser name, version, etc
# https://www.elastic.co/guide/en/logstash/current/plugins-filters-useragent.html useragent {
source=> "useragent"
prefix=> "browser_"
}

mutate {
remove_field => [ "log_timestamp"]
}
}

# output logs to console and to elasticsearch
output {
stdout {}
elasticsearch {
hosts => ["localhost:9200"]
}
}
Now all we need to do is start the logstash process and it will monitor any location(s) specified in the inputsection of the config.
cd C:\monitoring\logstash\bin
logstash.bat agent -f logstash.conf
[/code]
Now, once elasticsearch is running, any new log lines will now be pushed there in a nice format!
elasticsearch
Open a command prompt and navigate to the bin directory for elasticsearch.cd C:\monitoring\elasticsearch\bin
As a one off, you’ll need to run the install command.
service install
To start the elasticsearch process, simply execute the following:
service start
That’s it! elasticsearch should now be running at
http://localhost:9200. Hit that and you should get a nice json response to let you know that the service is running.
If you need to stop the process, simply execute:
service stop
If you need any more information you can check out the official docs on the elastic website.
Kibana
The simplest one!cd C:\monitoring\kibana\bin kibana.bat
[/code]
That’s it! There is a config file in the bin directory, but the defaults should suffice for now. Kibana should availble at
http://localhost:5601.
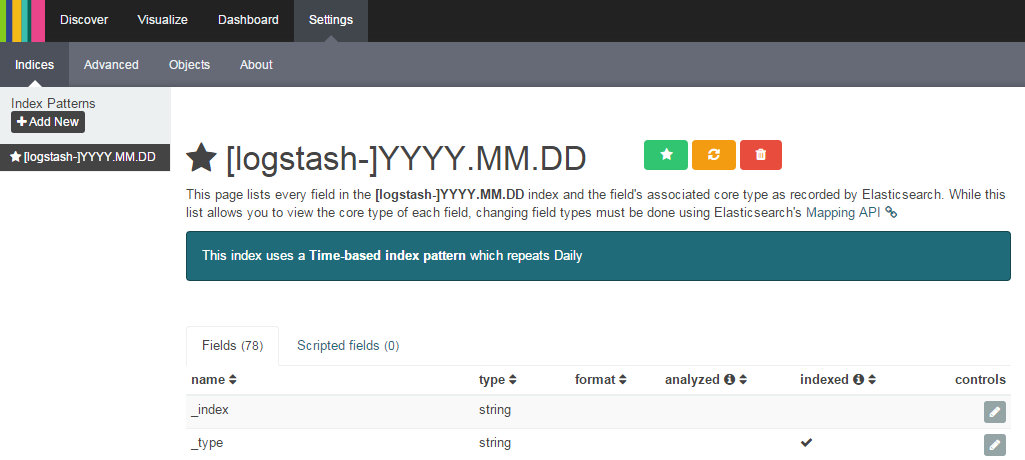
You’ll need to have a few logs in elasticsearch to complete the Kibana setup. When you first open Kibana you’ll be taken to a settings page titled “Configure an index pattern”. Check the checkbox “Use event times to create index names”. As we’re using elasticsearch, the defaults should be fine and you should be able to click “Create”.
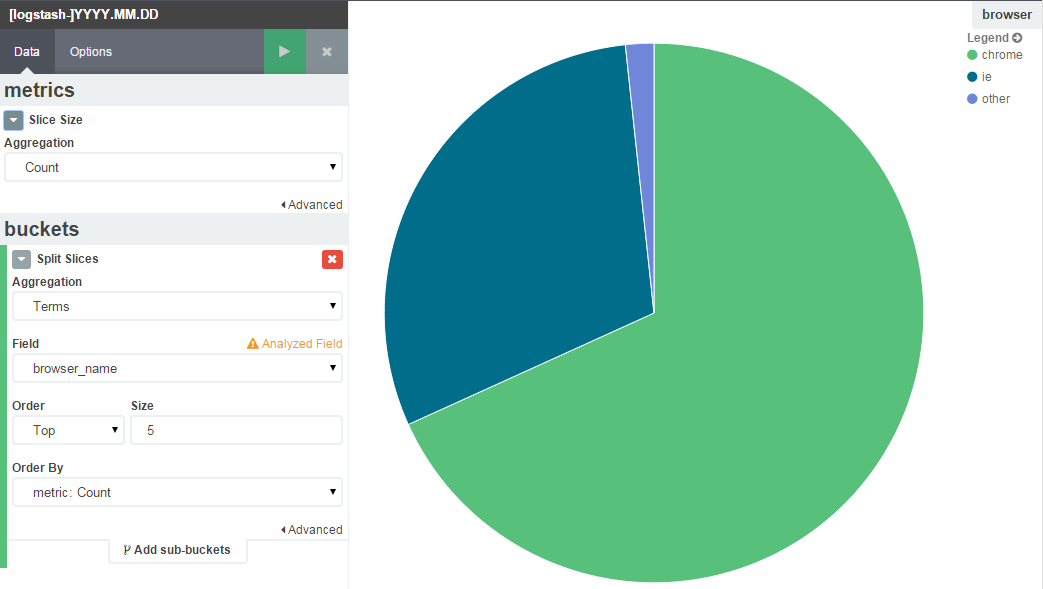
Create some useful graphs
The basic IIS logs contain some useful data, like http response code, response time and the requested URI. This should give enough information to identity some problems in our web application. We could easily tell if response times are more than a second or we’re getting lots of 404s, 500s, etc.Some examples below. You can see the filter criteria I have used in the left pane.
http response codes
browser breakdown
Can’t find your terms? They’re probably cached by Kibana.
Click “Settings”
Select your index
Click “Reload field list” (the yellow button)

相关文章推荐
- 在 rest 风格 url 资源中, GET/POST/PUT/DELETE 等方法各有什么作用与区别?
- 关于webview图片无法加载的问题?
- 如何修改oracle数据库用户密码
- AT指令建立TCP/IP 链接,并自收发数据
- iOS开发之画图板(贝塞尔曲线)
- LightOJ1125 Divisible Group Sums(DP)
- moo 11 request
- maven3 手动安装本地jar到仓库
- [Leetcode]Count of Smaller Numbers After Self
- 设计模式-抽象工厂模式
- poj3046 Ant Counting
- 修改内核参数,改善负载均衡效果
- iOS开发 贝塞尔曲线UIBezierPath
- MYSQL获取自增ID的四种方法
- 第一次使用Android Studio时你应该知道的一切配置(二):新建一个属于自己的工程并安装Genymotio...
- MySQL的information_schema的介绍(转)
- moo 10 Session与监听
- 深入浅出统计学
- MAVEN整合Spring+SpringMVC+Mybatis
- 关闭端口