MATLAB, Landsat 8, and AWS Public Data Sets
2015-12-28 20:45
459 查看
MATLAB,
Landsat 8, and AWS Public Data Sets
Posted by Steve Eddins, March 19, 2015A few weeks ago, a fellow developer (Kelly
Luetkemeyer) pulled me into his office to show me something he had been working on. It was very cool! Even better, it's now available for you to try. I'd like to introduce guest blogger Bruce Tannenbaum, product marketing manager for image processing and
test & measurement applications, to tell you all about it. Thanks, Bruce!
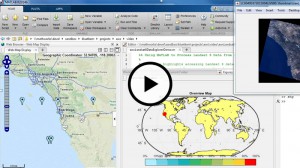
MathWorks is excited to announce a freely-downloadable MATLAB based
tool for accessing, processing, and visualizing Landsat 8 data hosted by AWS as part of its Landsat on AWS Public
Data Sets. With this tool, you can create a map display of scene locations with markers that show each scene’s metadata. You can download and visualize thumbnails and any of the 11 spectral bands. The tool includes clickable links for automatically combining
and processing spectral bands in a variety of approaches, such as NDVI and
color infrared. You can then visualize processed results in MATLAB and create map displays that help convey context about where the data is located on the Earth. This interactive tool is available on MATLAB
Central.(这个工具可以下载landsat8数据,在http://www.mathworks.com/matlabcentral/fileexchange/49907-landsat8-data-explorer上面可以下载这个工具,注意这个工具是基于2014版的mathlab) Watch the video below to see it in action.
How MATLAB and Landsat 8 Work Together
MATLAB provides a great environment for working with Earth observation data. It supports a wide range of file formats, including the GeoTIFF format used for Landsat 8 imagery. It supports accessing Earth science data over the Internet, such as the http requestsused by AWS Public Data Sets. The Image
Processing Toolbox extends MATLAB with a comprehensive set of image processing algorithms and tools for image processing, analysis, visualization, and algorithm development. The interactive tool for Landsat 8 imagery takes advantage of processing techniques
in the toolbox, such as adaptive
histogram equalization.
One challenge of working with Landsat 8 imagery is that you need to know where each scene is located. A scene represents a specific time and a rectangular surface region of about 185 by 180 kilometers. To make it easier to locate scenes, our tool creates a map
display with markers showing the centroid of each scene within the field of view. Additionally, the tool color-codes the markers to show cloud coverage, which is encapsulated in the metadata file for each scene. The most useful images have low cloud coverage;
the tool makes it easy to find images with 0-10% or 10-20% cloud coverage, which are the areas that are clearest.
In summary, Landsat 8 is an incredible resource for global change research and has been used in a diverse array of scientific endeavors including the monitoring of deforestation, population growth, and glacier recession. The tool offers a great way for MATLAB
users to build on the foundation of AWS support for Landsat 8 imagery. It can also be run on an EC2 instance, which avoids the download time and allows you to process many images in a shorter amount of time. MathWorks would like to hear your feedback,
including any additional features you would like to have.

相关文章推荐
- 局部边缘保持滤波(LEP)高动态范围图像HDR压缩 matlab程序(二)
- 局部边缘保持滤波(LEP)高动态范围图像HDR压缩 matlab程序(一)
- 《数字图像处理原理与实践(MATLAB版)》一书之代码Part2
- matlab -- simple note
- matlab下对caffe接口的调用
- bwlabel函数 matlab
- MNIST数据格式和Matlab(Octave)读取
- MatLab2012b/MatLab2013b分类器大全(svm,knn,随机森林等)
- MATLAB面向对象编程实现鱼群算法
- matlab 矩形窗汉明窗幅频特性对比
- matlab 2014a 安装以及 打包成java文件
- Matlab生成视频文件
- Medical image fusion using multi-level local extrema论文matlab程序
- 如何利用matlab爬虫抓数据
- matlab 中max函数用法
- Matlab视频处理
- Matlab模板匹配实现图像运动估计(频域实现)
- 如何实现matlab与c/c++混编
- Opencv 和Matlab的不同
- Matlab图像处理函数汇总