Arduino 平台与C语言程序设计-week4-Arduino Programs-Lesson1
2015-12-10 21:36
561 查看
This series of articles are the study notes of "An Arduino platform and C Programming", by Prof. Harris, Department of Computer Science, University of California, Irvine. This article is the notes
of week 4, lessen 1.
these IOT devices, there's code, there's a software part, but there's also the hardware part. And, you have to debug them both together, which adds complexity. We're just talking right now, about the software part. When you get to complicated pieces of code,
probably, you'll spend more time debugging than you'll spend writing the code in the first place. It's very common in complicated pieces of code. So we'll talk a little bit about how to do debugging and what's required.
Input pins, input interfaces (serial,Ethernet, etc.)
Registers and internal memory
Controllability isthe ability to control sources of data that are used by the system. This you need in order to apply tests, to test something, to seeif a feature works. So, when I say source
of data used by the system, what do Imean? So, the main source of data used by the system is going to be in theinput pins.
This might be done through your sensors,right? So, for instance, say I've got a switch connected to the input pins. Ican flip that switch off and on and control the input pins that way, which isthe best, right? Or, say I've got
a light sensor or something like that andit's connected to some pins, I wanna control that. I can change the lighting inthe room. Right, and control the pins in that way, indirectly. So, the inputpins are your main interface and if you want to do a test you
say well, Iwonder how my system works if the switch is flicked on and it's very bright inthe room. Then you can set that up and power it on and run it.
Now, the input pins aren't the only thing ifyou would like to be able to control. In addition to that, you would optimally liketo be able to control the internal data, meaning the storage elements, the registersand the memory inside
the chip.
So that's controllability. Controllabilityallows you to do testing to test certain circumstances that you think might becausing a bug or triggering a bug at any rate.
Output pins, output interfaces
Registers and internal memory
So addition to controllability you need observability. Observability is the ability to observe intermediate and final results.
So what do you need to observe? First thing you need to observe are the output pins. The outputs of the whole system, you need to see what values are on those pins. Now often you can observe
these directly through the actuators. So say the output pin is connected to an LED. You look at the LED, you can tell if the pen is high or low, right, something like that. You can alsodirectly observe the pins If you take a multimeter
and wire it straight to the pins. Multimeter, basically, you can read the voltage, and the current, and the resistance.
Now, another way to do it is using anoscilloscope. So if a signal, an output ping, changes slowly over time, then a multimeter is fine. Multimeters change
slowly, too so that works. But if the signal is changing fact in every millisecond, let's say. You can't see that on a multimeter. You would need to use a oscilloscope. And an oscilloscope basically shows me the voltage over time. So you'd wire to the oscilloscope
and you can see you can observe the data that way.
So you need controllability and observability somehow in order to do testing and do debugging. And we're primarily going to do that through the input and output pins.
difficulty that we're dealing with in this class, input and output pins are generally sufficient for that. But if you're doing this professionally or making bigger pieces of code, just look at the input and outputs, will probably not be sufficient to do debugging.

If pin 2 is incorrect, how do you locate the bug?
let's say you run your system and the output is on Pin 2. So you look at Pin 2, you look at it's values, see it's wired to an LED. And you see that it has the wrong value. So if it has the wrong value how do you know where the
bug is? The bug could be in the main function, it could be in the foo function, it could be in the bar function, or it could be in some nasty combination of the three. But how do you zero in on where the bug is? Just knowing that the output is wrong, the Pin
2 is wrong, doesn't give you a lot of information.
So I/O access for big systems is insufficient for doing debugging, but for what we're doing, it's what we have, and it's efficient.
this, okay, for the Arduino, but this is what you would like, this is what professionals have.
Observe data at stop points
So run control of the target. Run control of the target is very useful, and in fact, now we won't have it for the Arduino, but when you write code, you are going to have run control. So by run control I mean you’re going to be
able to stop and start the program in the middle. Not just wait till the end, just wait till it's done. You wanna be able to stop the program dead in the middle and at that point start looking at variables, let's say. Looking at register values, look at memory
contents, etc. Observe data at stop points. So generally this is done using breakpoints. We won't be using breakpoints, but breakpoints are basically you look at your code, and you see something's gone wrong, and you have a suspicion.
Real-time monitoring of the target. If you use the run control on the target it alters the timing. The timing execution of the target. So what that means is, that say your code, say you got a piece of code, say you got a loop.
And it takes one millisecond to execute the loop function. So if you do run control and you stop, set a break point in the middle of that, it runs for half a millisecond. You check things and you run it for another half a millisecond.But,
the total execution time is now much longer because you stopped it and did some debugging and checking. So,you have now completely altered the timing, the performance of the system. Now in a system like in IOT devices,
a lot of IOT devices, the timing is very important to the correct operation of the system. If you don't get the timing right it doesn't work. So real-time monitoring is what you would like. Real time is where you don't stop, you
don't set a break point and just stop the execution. You view data about the execution in real time. As it is executing, you are viewing the data.
For instance, say there's a value x of variable x, you don't have to stop the program and then say print x. You can just see x coming out on some pins while it's executing.Without slowing down the
processor, you can still see the value of x, let's say. That's run-time monitoring. That's fairly important for our timing constraint systems. There are many IOC devices where timing is important.
Related to that is timing and functional accuracy. Again, this is also related to the timing.
What this is referring to is the fact that sometimes the waypeople debug
is rather than running the code on a real system, theysimulate the code. Now,
if you simulate the code, the simulator usually doesn't run at the same speed as the actual system. So you're altering the timing performance just because you're doing simulation. So you want timing and functional accuracy.
You want the simulated version to be exactly the same in terms of timing as the original and you want functional accuracy. So another thing about simulators is that often simulators, they model most things but there's certain things they can't accurately model.
So they can't do certain behaviors.
For instance, if you're doing a simulation, simulating an analog to digital converter is very hard. Sometimes simulators won't do that. So it'll be inaccurate in its results for the A to D conversion. You might be doing an analog
read. And then your analog read data will be incorrect because the simulator wasn't accurate enough. So you want accuracy in terms of timing and in terms of functionality if you can get it.
for making IOT devices in general that you understand some of these debug environments. Because if you're gonna make some bigger ones, you're gonna use some of these.
kind of communication link. So the frontend is running on the host that you, the programmer, are accessing.
Now, there's a debug monitor, some code, hidden on the target. I say hidden, hidden like a bootloader. It's on the target, so there it has to be a debug monitor code that's running on the platform.
On the Arduino. So it's typically triggered when some debug event occurs.
Hitting a breakpoint, receiving request from host, etc.
So debug event, there are a lot of possible debug events. One debug event is a break point, let's say. You set a break point, say at the host, you said okay break on line 23, you select that. And then you run the code, and when
line 23 happens, the target stops. It recognizes the debug event and it stops, and then it stops running. And then it goes back to the host and lets the host have control again. So that's a typical debug event.
Often the host program, the front end will have some kind of a way you can force a debug event. You hit Ctrl+C, let's say, or click on a button, the Stop button, in a GUI built on a host. And then that sends a command to the
target to stop execution at that point.
Debug Monitor is the code running on the target that's talking to the host. So there's a communication going on between the target and the host. And that communication has to be managed by some code running on the target.
So that Code running on the target is the debug monitor. And it will stop execution of the code on the target. It will monitor the communication link to see commands from the host. It'll also provide debug information to the host.
So for instance, if the host you type, at the host you type print the contents of variable X. That command will be sent over the communication interface and then the debug monitor will receive it. Will retrieve the value of x
and send it back over the communication link. So the host front-end is actually talking to this debug monitor. Which is running on your Arduino, but along with whatever the actual code is, the functional code, the application code.
Good run control using breakpoint to stop execution
You can stop, you can set breakpoints to stop execution when you want to. You can actually force execution to stop from the host, you hit a button and it'll send the command to stop execution.
Debug monitor can alter memory and registers
All right, so the debug monitor is code that's running on the Arduino. Since it's running on the Arduino, it has direct access to the registers and the memory on the Arduino. So now with the debug monitor, you can actually control
the registers. You have control ability of the registers and the memory on the Arduino. And also you can read it, you have observability of those too.
Perfect functional accuracy
Perfect functional accuracy, so by that I mean. That the code when it executes, will run exactly the way it would on a real target platform. Because it is running on a real target platform. So you get perfect functional accuracy,
unlike say you had a simulator or something like that. You don't have to worry about functional accuracy.
So these debug interrupts, these debug events that allow interaction with the host, those things alter the timing. They stop, mess with the timing, they stop the
execution of the target, altering the timing. And so you can't get real time monitoring using a system like this. So, depending on how important timing is to you, this may or may not work. This may or may not be sufficient. Now even for timing critical
systems, using a remote debug setup is a good idea at first. But eventually you need to test the timing too so this type of setup wouldn't be as useful.
Need a space communication channel
And you need a spare communication channel, so the host and the target are speaking over some communication channel. So you need an extra communication channel, one that's not being used functionally. So if the application is
already using the Ethernet. The programs using it for whatever the application is. Then you can't use or, not that you can't, but you have a difficult time using the Ethernet also for debugging. Now, it turns that you can
share the Ethernet for both, but if you do that, then whenever the debugging information is going over the Ethernet pack, over the Ethernet connection. Then, functional data can't be going over the Ethernet connection. So, there's a tradeoff. And it can slow
the machine down and so on.
So, you need some spare internet, some spare connection, which we fortunately have within Arduino UR serial connection is what we are gonna to use, and we'll talk about that later.
Need program in RAM (not flash) to add breakpoints
Another thing is that you would like to have the program in RAM in order to add the breakpoints. So, this has to do with how software breakpoints are added. You know in Arduino, the program
is generally in flash. It's resident in flash and executed out of the flash memory. But, you would like to have it in RAM,because flash is slow to reprogram and RAM is fast.You can reprogram flash,
but it takes a long time. You have to, relatively long time. I mean it takes Lots of milliseconds, that's slow. So you would like it to be in RAM because whenever you set a break point, you have to alter the code temporarily. You go to the place, the
liner, the code where the breakpoints gonna be, and you change that instruction. To something else temporarily in order to set it to stop the code at that point. So, you need to be able to change the code relatively quickly in order
to set these breakpoints. And flash makes that harder.
Debug logic that's actuallybuilt in to the processor. So inside the processor or the microcontroller, in addition to all the logic that actually executes the code.They put debug logic hardware
that actually does debug activities. They build it right in, so you don't have to have a debug monitor anymore. The debug monitor was a program that runs on your Arduino, let's say. This is saying look, forget the
program. We're gonna put hardware in there that does those functions directly. Whichmakes it faster, also makes it possible to do in parallel. It's efficient, it costs a little bit, because it costs area on the chip. The
chip has to get bigger to accommodate the extra logic that you're embedding in there.
Typically an optional IP block
Embedded trace macrocell (ARM)
Background debug mode (Freescale)
There are several embedded trace macrocell from ARMs. The ARM processors, they have embedded trace macrocells, which are the name for their debug logic or, for some part of their debug logic, they have several trace macrocells.
But embedded trace macrocells the main one. Freescale uses background debug mode, which is a similar idea.
seems wasted, it's not using but not being used, right, because you're not generally debugging it out in the field.
with, is using. So in order to do that, you need some pins to send that data. And that's important, thepins are precious. There aren't that many pins on a chip. Even a very densely packed
chip has a lot of pins. Compared to the amount of logic inside the chip, there are very few pins. So, pins are precious. So, you don't wanna use too many pins just for debugging purposes. But these debug interfaces require a certain number of pins.
location then it stops. It's every time you write, it'll check and if you write to this location then it stops the code.
access the memory locations at runtime without stopping the code. That you can observe the memory locations. You can read them and observe them. You can change process and value so change register values and things like this.
one step at a time, one instruction at a time. Which allows you to basically find grain one control so execute one instruction, check the value, execute the next instruction, check the value. And you can zero in on
exactly when the value is going wrong.
They can put print statements, effectively print statements, which send data from the processor to the host. So you can basically add error messages manually. You can say, oh, this error has happened now, and it'll be sent on the wires, whatever the communication
interface is. It'll be sent to the host, and the person debugging can see the messages. And that can be helpful.
access happened at this time this happened at that time. Sometimes, in timing critical systems, you wanna know exactly when things happen and the time separation between events. So the hardware that you add for debug can add that timestamp and send it to the
host.
up to that crash. You'd like to see a trace, the list of instructions that were executed. So you can follow it back and sort of guess at which instruction or which set of instructions might have caused that crash.
Arduino, when you're running the code. Now, one way is to just look at the output pins, but we often wanna see more important, more detailed information, to put it like that. And so, we need some way to transfer information from the Arduino, or some microcontroller,
to the host that we're debugging from. And serial interface is how we're gonna do that. So, we'll talk about that right now.
- Only 1 bit needed (plus common ground)
Parallel data transmitted serially
Original bytes/ words regrouped by the receiver
Many protocols are serial to reduce pin usage
- Pins are precious
So, serial protocols. We're talking about a protocol, a set of protocols really, that speak between the host and the microcontroller. And we're going to focus on serial protocol here. Serial protocol in general is where you transmit
data serially. So you transmit data one bit at a time or one chunk at a time. In our case, one bit at a time. Instead of, say, eight bits at a time. The Arduino, the microprocessor in there, the Mega 328, it's a eight bit processor, so each chunk of data is
eight bit. But we're gonna be transmitting one bit at a time. So why would we do that? So the parallel data, eight bits parallel, are gonna be transmitted one bit at a time. The reason why we do this, is because it saves us pins.
So, you don't want to have to use eight pins for debugging if you could help it. You would rather use one pin. So that's why serial protocols are very common for this purpose, for debugging interfaces, because they don't use
many pins. Now, they are slower, right? Because instead of sending all eight pins in one clock cycle you have to send one at a time. So it slows you down but it saves pins and pins are important.
for serial communication between devices. It gives you long distance actually.
Universal Asynchronous Receiver/Transmitter
Used for serial communication between devices
square wave has rising edges and falling edges. And all the devices in the system time themselves off of the rising edge. So, one goal when you're using a clock is that every item,every part, that's receiving the clock, they have
to receive the rising edge at the same time. So if you look at a circuit board, say you look at the mother board of a computer, there is going to be a system clock. And the system clock it goes to all the parts that receive all the chips, let's say,
on the mother board. And the system clock is gonna run at a certain frequency. And the rising edge has to travel from wherever the clock is generated, to the chip. And there is a certain amount of distance. Maybe it's traveling this far. But these things are
fast. So this far is a long distance. So it is important that the rising edge arrives at every destination at the same time, or very close to it. That's the assumption for all of our systems, that all the parts on your device that are receiving the clock,
they all receive the rising edge at the same time. Now that's hard to guarantee in any kind of a big system because even this much distance takes a certain amount of time to travel. I mean, even for light. And these signals are travelling a lot slower than
light. I mean, if you think about how fast these signals are traveling. So just give you ball park numbers, right, take the speed of light. Now I don't remember the speed of light off the top of my head, but I happen to remember that, well I know that the
clock rate of typical processes. Let's take a processor, let's say 1 GHz clock rate. Now that's a slow clock rate for a modern processor, for a desktop or something like that. But, let's say 1GHz. So if you have a one gigahertz clock rate, then you have a
one nanosecond clock period. That means between two clock edges, you've got one nanosecond of time in between there. So, then how far does the light travel, even light which is the fastest, how far this light travel in a nanosecond? I don't know, about so
far. I don't remember the distance, I'd have to compute it, but you can check into that. But it's some short distance, okay. This isn't a lot of distance. And a board, a motherboard can be bigger than this. So what this is saying is that in a clock, even the
fastest signal can't travel from one end of the board, right. And remember that our electrical signals are traveling a lot slower than light is. So the reason I bring this is up is because guaranteeing that every device in the system receives a rising clock
edge at the same time is extremely hard. Because they're all different distances away from wherever the clock generation is. So it's very hard. And that makes UART a nice thing, becauseUART is asynchronous meaning it doesn't have
a clock. It doesn't require a clock so that's a good feature of UART.
can work over very long distances because it doesn't require them to have the same clock. Yeah, so you get the longer communication distance.
the same instant. There's always a little bit of difference in the time when they receive it. And that difference is called clock skew. And you want to minimize clock skew. But clock skew isn't such a problem with UART, because it doesn't have a clock.
to a network, AOL or whatever, CompuServe. You take a phone and actually connect it to your computer through a modem, through a big fat modem, and those thing use UART. Real slow communication and very long distance, but it worked.
effective, protocols nowadays. So it's not well-used outside of embedded systems and IoT devices like we're dealing with. It's still using those domains for debugging mostly.
It’s been replaced by things like USB, ethernet connections, I2C, SPI, we'll cover those later. But there are a lot of other options you can use instead of UART nowadays. But it's simple, UART is very simple protocol and it's
low hardware overhead. That's another reason why people still use it in embedded systems for communication, for debugging and things like that. So it's just so convenient to use. And it's built into most microcontrollers. So most microcontrollers have hardware
support for UART, so why not use that for debugging?
of week 4, lessen 1.
1. Lesson 1
1.1 Lecture1-1: Debugging
So this lecture and really this module is all about debugging. So debugging is after you write your code and you try to run it and it doesn't work, trying to fix the code. And, not just your code really, I mean, in general withthese IOT devices, there's code, there's a software part, but there's also the hardware part. And, you have to debug them both together, which adds complexity. We're just talking right now, about the software part. When you get to complicated pieces of code,
probably, you'll spend more time debugging than you'll spend writing the code in the first place. It's very common in complicated pieces of code. So we'll talk a little bit about how to do debugging and what's required.
1.1.1 Debuging and Trace
(1) Controllability
Ability to control source ofdata used by the systemInput pins, input interfaces (serial,Ethernet, etc.)
Registers and internal memory
Controllability isthe ability to control sources of data that are used by the system. This you need in order to apply tests, to test something, to seeif a feature works. So, when I say source
of data used by the system, what do Imean? So, the main source of data used by the system is going to be in theinput pins.
This might be done through your sensors,right? So, for instance, say I've got a switch connected to the input pins. Ican flip that switch off and on and control the input pins that way, which isthe best, right? Or, say I've got
a light sensor or something like that andit's connected to some pins, I wanna control that. I can change the lighting inthe room. Right, and control the pins in that way, indirectly. So, the inputpins are your main interface and if you want to do a test you
say well, Iwonder how my system works if the switch is flicked on and it's very bright inthe room. Then you can set that up and power it on and run it.
Now, the input pins aren't the only thing ifyou would like to be able to control. In addition to that, you would optimally liketo be able to control the internal data, meaning the storage elements, the registersand the memory inside
the chip.
So that's controllability. Controllabilityallows you to do testing to test certain circumstances that you think might becausing a bug or triggering a bug at any rate.
(2) Observability
Ability to observe intermediate and final resultsOutput pins, output interfaces
Registers and internal memory
So addition to controllability you need observability. Observability is the ability to observe intermediate and final results.
So what do you need to observe? First thing you need to observe are the output pins. The outputs of the whole system, you need to see what values are on those pins. Now often you can observe
these directly through the actuators. So say the output pin is connected to an LED. You look at the LED, you can tell if the pen is high or low, right, something like that. You can alsodirectly observe the pins If you take a multimeter
and wire it straight to the pins. Multimeter, basically, you can read the voltage, and the current, and the resistance.
Now, another way to do it is using anoscilloscope. So if a signal, an output ping, changes slowly over time, then a multimeter is fine. Multimeters change
slowly, too so that works. But if the signal is changing fact in every millisecond, let's say. You can't see that on a multimeter. You would need to use a oscilloscope. And an oscilloscope basically shows me the voltage over time. So you'd wire to the oscilloscope
and you can see you can observe the data that way.
So you need controllability and observability somehow in order to do testing and do debugging. And we're primarily going to do that through the input and output pins.
1.1.2 I/O Access Is Insufficient
I/O, input and output access, is insufficient.So that's maybe a strong term, not insufficient. It is maybe more difficult to debug through only the inputs and outputs, but with the level ofdifficulty that we're dealing with in this class, input and output pins are generally sufficient for that. But if you're doing this professionally or making bigger pieces of code, just look at the input and outputs, will probably not be sufficient to do debugging.
If pin 2 is incorrect, how do you locate the bug?
let's say you run your system and the output is on Pin 2. So you look at Pin 2, you look at it's values, see it's wired to an LED. And you see that it has the wrong value. So if it has the wrong value how do you know where the
bug is? The bug could be in the main function, it could be in the foo function, it could be in the bar function, or it could be in some nasty combination of the three. But how do you zero in on where the bug is? Just knowing that the output is wrong, the Pin
2 is wrong, doesn't give you a lot of information.
So I/O access for big systems is insufficient for doing debugging, but for what we're doing, it's what we have, and it's efficient.
1.1.3 Properties of a Debugging Environment
So what would you like to have in terms of debugging environment? And what I'm talking about here is really optimal, in terms of, if you're building a bigger system or more complicated system what you would like. We don't havethis, okay, for the Arduino, but this is what you would like, this is what professionals have.
(1) Run control of the target
Start and stop the program executionObserve data at stop points
So run control of the target. Run control of the target is very useful, and in fact, now we won't have it for the Arduino, but when you write code, you are going to have run control. So by run control I mean you’re going to be
able to stop and start the program in the middle. Not just wait till the end, just wait till it's done. You wanna be able to stop the program dead in the middle and at that point start looking at variables, let's say. Looking at register values, look at memory
contents, etc. Observe data at stop points. So generally this is done using breakpoints. We won't be using breakpoints, but breakpoints are basically you look at your code, and you see something's gone wrong, and you have a suspicion.
(2) Real-time monitoring of target execution
Non-intrusive in terms of performanceReal-time monitoring of the target. If you use the run control on the target it alters the timing. The timing execution of the target. So what that means is, that say your code, say you got a piece of code, say you got a loop.
And it takes one millisecond to execute the loop function. So if you do run control and you stop, set a break point in the middle of that, it runs for half a millisecond. You check things and you run it for another half a millisecond.But,
the total execution time is now much longer because you stopped it and did some debugging and checking. So,you have now completely altered the timing, the performance of the system. Now in a system like in IOT devices,
a lot of IOT devices, the timing is very important to the correct operation of the system. If you don't get the timing right it doesn't work. So real-time monitoring is what you would like. Real time is where you don't stop, you
don't set a break point and just stop the execution. You view data about the execution in real time. As it is executing, you are viewing the data.
For instance, say there's a value x of variable x, you don't have to stop the program and then say print x. You can just see x coming out on some pins while it's executing.Without slowing down the
processor, you can still see the value of x, let's say. That's run-time monitoring. That's fairly important for our timing constraint systems. There are many IOC devices where timing is important.
(3) Timing and functional accuracy
Debugged system should act like the real systemRelated to that is timing and functional accuracy. Again, this is also related to the timing.
What this is referring to is the fact that sometimes the waypeople debug
is rather than running the code on a real system, theysimulate the code. Now,
if you simulate the code, the simulator usually doesn't run at the same speed as the actual system. So you're altering the timing performance just because you're doing simulation. So you want timing and functional accuracy.
You want the simulated version to be exactly the same in terms of timing as the original and you want functional accuracy. So another thing about simulators is that often simulators, they model most things but there's certain things they can't accurately model.
So they can't do certain behaviors.
For instance, if you're doing a simulation, simulating an analog to digital converter is very hard. Sometimes simulators won't do that. So it'll be inaccurate in its results for the A to D conversion. You might be doing an analog
read. And then your analog read data will be incorrect because the simulator wasn't accurate enough. So you want accuracy in terms of timing and in terms of functionality if you can get it.
1.2 Lecture1-2: Debug Environments
In this lecture we'll start talking about some of the debug environments that exist. Really a couple of debug environments that are commonly used. Arduino won't give us access to these environments. But it's sort of importantfor making IOT devices in general that you understand some of these debug environments. Because if you're gonna make some bigger ones, you're gonna use some of these.
1.2.1 Remote Debugger
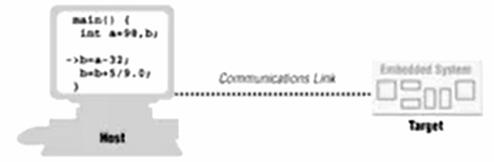
(1) Frontend running on the host
So, the host computer is where you as a user, as a programmer. Actually interface with the debugging environment. So, you are using the typing debug commands into the host. Those are getting transmitted to the target over somekind of communication link. So the frontend is running on the host that you, the programmer, are accessing.
(2) Debug monitor hidden on target
Typically triggered when debug events occurNow, there's a debug monitor, some code, hidden on the target. I say hidden, hidden like a bootloader. It's on the target, so there it has to be a debug monitor code that's running on the platform.
On the Arduino. So it's typically triggered when some debug event occurs.
Hitting a breakpoint, receiving request from host, etc.
So debug event, there are a lot of possible debug events. One debug event is a break point, let's say. You set a break point, say at the host, you said okay break on line 23, you select that. And then you run the code, and when
line 23 happens, the target stops. It recognizes the debug event and it stops, and then it stops running. And then it goes back to the host and lets the host have control again. So that's a typical debug event.
Often the host program, the front end will have some kind of a way you can force a debug event. You hit Ctrl+C, let's say, or click on a button, the Stop button, in a GUI built on a host. And then that sends a command to the
target to stop execution at that point.
(3) Debug monitor maintains communication link
So you get a Debug Monitor. And theDebug Monitor is the code running on the target that's talking to the host. So there's a communication going on between the target and the host. And that communication has to be managed by some code running on the target.
So that Code running on the target is the debug monitor. And it will stop execution of the code on the target. It will monitor the communication link to see commands from the host. It'll also provide debug information to the host.
So for instance, if the host you type, at the host you type print the contents of variable X. That command will be sent over the communication interface and then the debug monitor will receive it. Will retrieve the value of x
and send it back over the communication link. So the host front-end is actually talking to this debug monitor. Which is running on your Arduino, but along with whatever the actual code is, the functional code, the application code.
1.2.2 Remote Debug Tradeoffs
(1) Advantages
So, advantages of this type of set up.Good run control using breakpoint to stop execution
You can stop, you can set breakpoints to stop execution when you want to. You can actually force execution to stop from the host, you hit a button and it'll send the command to stop execution.
Debug monitor can alter memory and registers
All right, so the debug monitor is code that's running on the Arduino. Since it's running on the Arduino, it has direct access to the registers and the memory on the Arduino. So now with the debug monitor, you can actually control
the registers. You have control ability of the registers and the memory on the Arduino. And also you can read it, you have observability of those too.
Perfect functional accuracy
Perfect functional accuracy, so by that I mean. That the code when it executes, will run exactly the way it would on a real target platform. Because it is running on a real target platform. So you get perfect functional accuracy,
unlike say you had a simulator or something like that. You don't have to worry about functional accuracy.
(2) Disadvantages
Debug interrupts alter timing so real-time monitoring is not possibleSo these debug interrupts, these debug events that allow interaction with the host, those things alter the timing. They stop, mess with the timing, they stop the
execution of the target, altering the timing. And so you can't get real time monitoring using a system like this. So, depending on how important timing is to you, this may or may not work. This may or may not be sufficient. Now even for timing critical
systems, using a remote debug setup is a good idea at first. But eventually you need to test the timing too so this type of setup wouldn't be as useful.
Need a space communication channel
And you need a spare communication channel, so the host and the target are speaking over some communication channel. So you need an extra communication channel, one that's not being used functionally. So if the application is
already using the Ethernet. The programs using it for whatever the application is. Then you can't use or, not that you can't, but you have a difficult time using the Ethernet also for debugging. Now, it turns that you can
share the Ethernet for both, but if you do that, then whenever the debugging information is going over the Ethernet pack, over the Ethernet connection. Then, functional data can't be going over the Ethernet connection. So, there's a tradeoff. And it can slow
the machine down and so on.
So, you need some spare internet, some spare connection, which we fortunately have within Arduino UR serial connection is what we are gonna to use, and we'll talk about that later.
Need program in RAM (not flash) to add breakpoints
Another thing is that you would like to have the program in RAM in order to add the breakpoints. So, this has to do with how software breakpoints are added. You know in Arduino, the program
is generally in flash. It's resident in flash and executed out of the flash memory. But, you would like to have it in RAM,because flash is slow to reprogram and RAM is fast.You can reprogram flash,
but it takes a long time. You have to, relatively long time. I mean it takes Lots of milliseconds, that's slow. So you would like it to be in RAM because whenever you set a break point, you have to alter the code temporarily. You go to the place, the
liner, the code where the breakpoints gonna be, and you change that instruction. To something else temporarily in order to set it to stop the code at that point. So, you need to be able to change the code relatively quickly in order
to set these breakpoints. And flash makes that harder.
1.2.3 Embedded Debug Interfaces
(1) Many modern processors include embedded debug logic
Another way to go. Which is more common in modern processors, is the use of an embedded debug interface. So what this is, you see this in modern processors nowadays.You have embedded debug logic.Debug logic that's actuallybuilt in to the processor. So inside the processor or the microcontroller, in addition to all the logic that actually executes the code.They put debug logic hardware
that actually does debug activities. They build it right in, so you don't have to have a debug monitor anymore. The debug monitor was a program that runs on your Arduino, let's say. This is saying look, forget the
program. We're gonna put hardware in there that does those functions directly. Whichmakes it faster, also makes it possible to do in parallel. It's efficient, it costs a little bit, because it costs area on the chip. The
chip has to get bigger to accommodate the extra logic that you're embedding in there.
Typically an optional IP block
Embedded trace macrocell (ARM)
Background debug mode (Freescale)
There are several embedded trace macrocell from ARMs. The ARM processors, they have embedded trace macrocells, which are the name for their debug logic or, for some part of their debug logic, they have several trace macrocells.
But embedded trace macrocells the main one. Freescale uses background debug mode, which is a similar idea.
(2) Debug logic permanently built into the processor
Debug logic is permanently built into the processor. So, what that means is that logic, since it's debug logic generally is used when you're developing the system. But once you manufacture the system and you sell it. That logicseems wasted, it's not using but not being used, right, because you're not generally debugging it out in the field.
(3) A few dedicated debug pins are added
A few dedicated pins have to be added. So this debug information that is extracted by this embedded debug logic. It has to be sent to, say, a host machine, right, that the user is interfacingwith, is using. So in order to do that, you need some pins to send that data. And that's important, thepins are precious. There aren't that many pins on a chip. Even a very densely packed
chip has a lot of pins. Compared to the amount of logic inside the chip, there are very few pins. So, pins are precious. So, you don't wanna use too many pins just for debugging purposes. But these debug interfaces require a certain number of pins.
1.2.4 Debug and Trace Features
Usually they transfer data serially, so they need very few pins, but they do need a few pins dedicated to debug. So here are some of the debug and trace features you would expect to find in embedded debug logic.(1) Breakpoint, stopping points in the code
Break points, the ability to set break points inside your code.(2) Watch points, memory locations which trigger stop
Watch points, where what happens is it It's sort of like a break point. It's at a certain point in code, let's say or a memory location. If some event happens then it stops the code. So maybe if you write to a particular memorylocation then it stops. It's every time you write, it'll check and if you write to this location then it stops the code.
(3) On-the-fly memory access
On-the-fly memory access. So you're gonnaaccess the memory locations at runtime without stopping the code. That you can observe the memory locations. You can read them and observe them. You can change process and value so change register values and things like this.
(4) Single-step through the code
Single step through the codes isone step at a time, one instruction at a time. Which allows you to basically find grain one control so execute one instruction, check the value, execute the next instruction, check the value. And you can zero in on
exactly when the value is going wrong.
(5) Export exceptions to the debugger (hit a watch point)
You can export exceptions to debugger, so when you hit a watchpoint it can go to debugger logic and start running debug logic if you want it to.(6) Export software-generated data (printf)
You can export software generated data. So, what that means is actually we're gonna be doing, this will actually be doing something just like this. You can basically allow that the person who writes the code running on your target.They can put print statements, effectively print statements, which send data from the processor to the host. So you can basically add error messages manually. You can say, oh, this error has happened now, and it'll be sent on the wires, whatever the communication
interface is. It'll be sent to the host, and the person debugging can see the messages. And that can be helpful.
(7) Timestamp information for each event
Timestamp information for each event so you can trace the events. So when events happen like certain interesting things happen a memory access happens or something likes that. You can send a timestamp and say look this memoryaccess happened at this time this happened at that time. Sometimes, in timing critical systems, you wanna know exactly when things happen and the time separation between events. So the hardware that you add for debug can add that timestamp and send it to the
host.
(8) Instruction trace (special purpose HW needed)
An instruction trace, you get a special purpose hardware that tells you which instructions were executed in what sequence. So this is very useful sometimes. If you know something crashed. You want to see what happened that ledup to that crash. You'd like to see a trace, the list of instructions that were executed. So you can follow it back and sort of guess at which instruction or which set of instructions might have caused that crash.
1.3 Lecture1-3: Debug via Serial
This lecture we'll talk about how we'll do debugging using the Arduino. Specifically, how are we gonna do observability? How are we gonna get observability? So observing information about what's going on when you're running theArduino, when you're running the code. Now, one way is to just look at the output pins, but we often wanna see more important, more detailed information, to put it like that. And so, we need some way to transfer information from the Arduino, or some microcontroller,
to the host that we're debugging from. And serial interface is how we're gonna do that. So, we'll talk about that right now.
1.3.1 Serial Protocols
Data is transmitted serially- Only 1 bit needed (plus common ground)
Parallel data transmitted serially
Original bytes/ words regrouped by the receiver
Many protocols are serial to reduce pin usage
- Pins are precious
So, serial protocols. We're talking about a protocol, a set of protocols really, that speak between the host and the microcontroller. And we're going to focus on serial protocol here. Serial protocol in general is where you transmit
data serially. So you transmit data one bit at a time or one chunk at a time. In our case, one bit at a time. Instead of, say, eight bits at a time. The Arduino, the microprocessor in there, the Mega 328, it's a eight bit processor, so each chunk of data is
eight bit. But we're gonna be transmitting one bit at a time. So why would we do that? So the parallel data, eight bits parallel, are gonna be transmitted one bit at a time. The reason why we do this, is because it saves us pins.
So, you don't want to have to use eight pins for debugging if you could help it. You would rather use one pin. So that's why serial protocols are very common for this purpose, for debugging interfaces, because they don't use
many pins. Now, they are slower, right? Because instead of sending all eight pins in one clock cycle you have to send one at a time. So it slows you down but it saves pins and pins are important.
1.3.2 UART
Now there are many different, or rather, several different serial protocols. We are gonna focus on UART. UART stands for Universal Asynchronous Receiver/Transmitter. It is an old, old protocol. Still useful though. It's usedfor serial communication between devices. It gives you long distance actually.
Universal Asynchronous Receiver/Transmitter
Used for serial communication between devices
(1) UART is asynchronous no shared clock
It's asynchronous,meaning no shared clock. So what we mean by this is that, so we talked about what a clock is. A clock is basically a square wave. And thesquare wave has rising edges and falling edges. And all the devices in the system time themselves off of the rising edge. So, one goal when you're using a clock is that every item,every part, that's receiving the clock, they have
to receive the rising edge at the same time. So if you look at a circuit board, say you look at the mother board of a computer, there is going to be a system clock. And the system clock it goes to all the parts that receive all the chips, let's say,
on the mother board. And the system clock is gonna run at a certain frequency. And the rising edge has to travel from wherever the clock is generated, to the chip. And there is a certain amount of distance. Maybe it's traveling this far. But these things are
fast. So this far is a long distance. So it is important that the rising edge arrives at every destination at the same time, or very close to it. That's the assumption for all of our systems, that all the parts on your device that are receiving the clock,
they all receive the rising edge at the same time. Now that's hard to guarantee in any kind of a big system because even this much distance takes a certain amount of time to travel. I mean, even for light. And these signals are travelling a lot slower than
light. I mean, if you think about how fast these signals are traveling. So just give you ball park numbers, right, take the speed of light. Now I don't remember the speed of light off the top of my head, but I happen to remember that, well I know that the
clock rate of typical processes. Let's take a processor, let's say 1 GHz clock rate. Now that's a slow clock rate for a modern processor, for a desktop or something like that. But, let's say 1GHz. So if you have a one gigahertz clock rate, then you have a
one nanosecond clock period. That means between two clock edges, you've got one nanosecond of time in between there. So, then how far does the light travel, even light which is the fastest, how far this light travel in a nanosecond? I don't know, about so
far. I don't remember the distance, I'd have to compute it, but you can check into that. But it's some short distance, okay. This isn't a lot of distance. And a board, a motherboard can be bigger than this. So what this is saying is that in a clock, even the
fastest signal can't travel from one end of the board, right. And remember that our electrical signals are traveling a lot slower than light is. So the reason I bring this is up is because guaranteeing that every device in the system receives a rising clock
edge at the same time is extremely hard. Because they're all different distances away from wherever the clock generation is. So it's very hard. And that makes UART a nice thing, becauseUART is asynchronous meaning it doesn't have
a clock. It doesn't require a clock so that's a good feature of UART.
(2) Why UART give you long communication distance than other protocols?
UART doesn't require a clock. As a result of that,UART is slower than a lot of other protocols and synchronous protocols might be. But it has that advantage thatitcan work over very long distances because it doesn't require them to have the same clock. Yeah, so you get the longer communication distance.
(3) Clock skew is not a problem
Clock skew is not a problem. So skew is basically, in a synchronous system, all the clock edges, all the components receiving the clock, have to receive the clock edge at the same instant. But they never receive it at exactlythe same instant. There's always a little bit of difference in the time when they receive it. And that difference is called clock skew. And you want to minimize clock skew. But clock skew isn't such a problem with UART, because it doesn't have a clock.
1.3.3 UART applications
(1) Used by modems to communicate with network
UART used to be much more used. Not so much anymore. It's been replaced by other protocols. But it was used by modems to connect to networks. So if you're old enough, you remember that people would actually take, when you connectto a network, AOL or whatever, CompuServe. You take a phone and actually connect it to your computer through a modem, through a big fat modem, and those thing use UART. Real slow communication and very long distance, but it worked.
(2) Computers used to have an RS232 port, standard
Computers used to have an RS232 port, standard. RS232 is a port made to communicate with UART. So they used to come standard. They don't do that anymore because UART has been sort of supplanted, taken over by other better, moreeffective, protocols nowadays. So it's not well-used outside of embedded systems and IoT devices like we're dealing with. It's still using those domains for debugging mostly.
(3) Not well used anymore, outside of embedded systems
Replaced by USB, Ethernet, I2C, SPIIt’s been replaced by things like USB, ethernet connections, I2C, SPI, we'll cover those later. But there are a lot of other options you can use instead of UART nowadays. But it's simple, UART is very simple protocol and it's
low hardware overhead. That's another reason why people still use it in embedded systems for communication, for debugging and things like that. So it's just so convenient to use. And it's built into most microcontrollers. So most microcontrollers have hardware
support for UART, so why not use that for debugging?

相关文章推荐
- C/C++ Quick Sort Algorithm
- C/C++ Quick Sort Algorithm
- c++设计模式(4)------建造者模式
- 一起talk C栗子吧(第七十三回:C语言实例--DIY pwd命令)
- c语言指针
- C++中的萃取机制(traits)
- 对象池 c++11
- 条款01:视C++为一个语言联邦
- c++实现 斐波那契数
- 浅谈C++友元
- C++ using关键字作用总结
- effective c++学习笔记3
- 棋盘覆盖问题、半数集问题算法解析-C语言
- PAT乙级——1007 A除以B (C/C++)
- PAT乙级——1006 部分A+B (C/C++)
- C/C++的64位整型 不同编译器间的比较(附:各类型数据的范围)
- PAT乙级——1005 德才论 (C/C++)
- PAT乙级——1004 福尔摩斯的约会 (C/C++)
- 解决Visual C++ 编译器中混合 .c 文件时收到 C1853 预编译头错误的方法(转)
- PAT乙级——1003 数素数 (C/C++)