ros用rqt_graph显示节点关系、rqt_plot显示数据流、rqt_console显示节点的输出、rqt_logger_level
2015-11-26 16:36
731 查看
Using rqt_graph
rqt_graph creates a dynamic graph of what's going on in the system. rqt_graph is part of therqt package. Unless you already have it installed, run:
$ sudo apt-get install ros-<distro>-rqt
$ sudo apt-get install ros-<distro>-rqt-common-plugins
replacing <distro> with the name of your ROS distribution (fuerte, groovy, etc.)
In a new terminal:
$ rosrun rqt_graph rqt_graph
Using rqt_plot
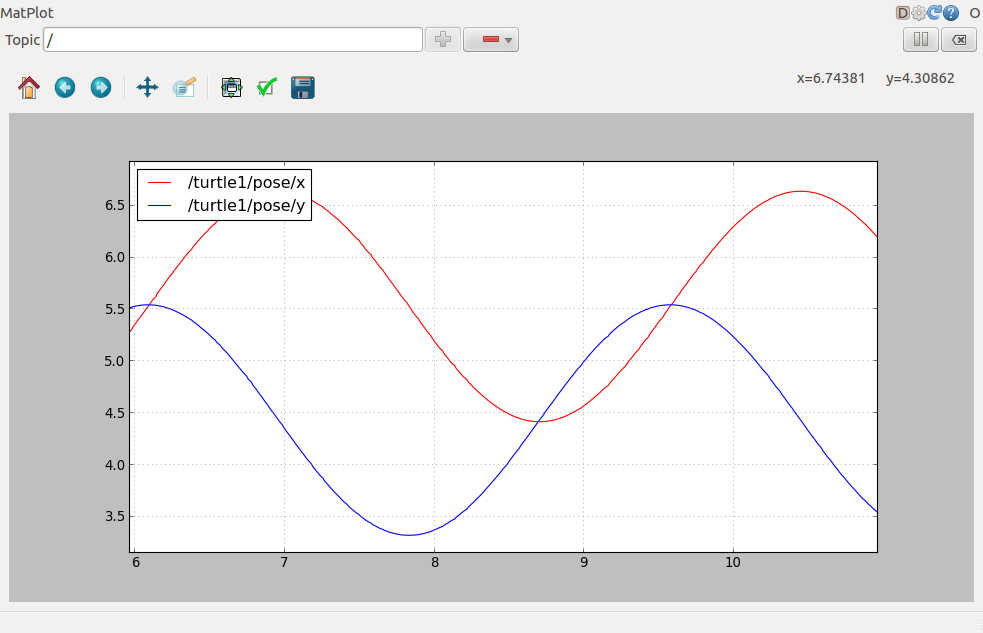
Note: If you're using electric or earlier, rqt is not available. Use rxplot instead. rqt_plot displays a scrolling time plot of the data published on topics. Here we'll use rqt_plot to plot the data being published on the /turtle1/pose topic. First, start rqt_plot by typing [code]$ rosrun rqt_plot rqt_plot
in a new terminal. In the new window that should pop up, a text box in the upper left corner gives you the ability to add any topic to the plot. Typing /turtle1/pose/x will highlight the plus button, previously disabled. Press it and repeat the same procedure with the topic /turtle1/pose/y. You will now see the turtle's x-y location plotted in the graph.
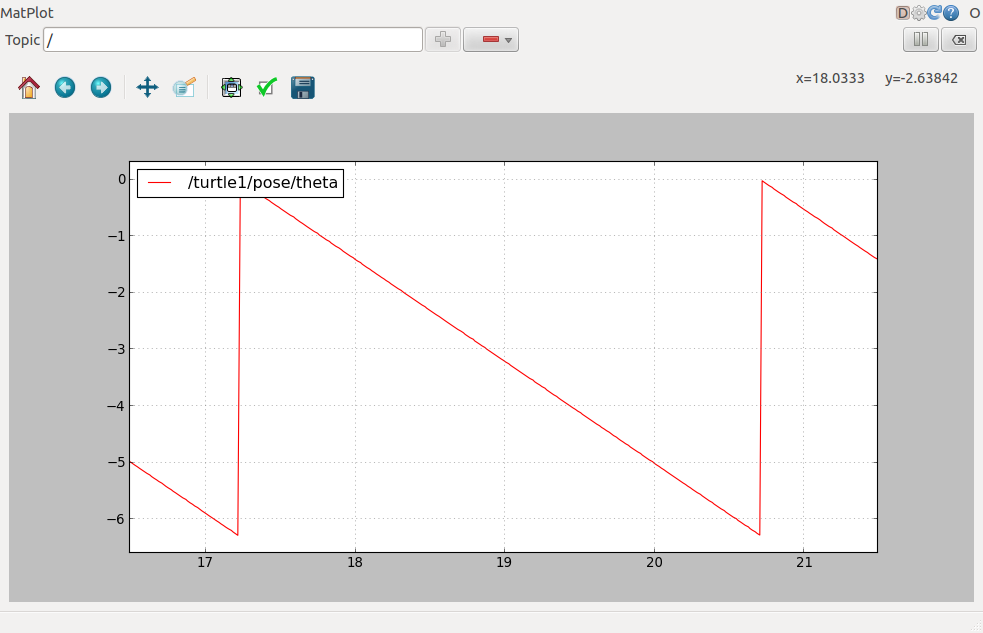
Pressing the minus button shows a menu that allows you to hide the specified topic from the plot. Hiding both the topics you just added and adding /turtle1/pose/theta will result in the plot shown in the next figure.
That's it for this section, use Ctrl-C to kill the rostopic terminals but keep your turtlesim running. Now that you understand how ROS topics work, let's look at how services and parameters work.
http://wiki.ros.org/ROS/Tutorials/UnderstandingTopics [title2]Using rqt_console and rqt_logger_level[/title2]
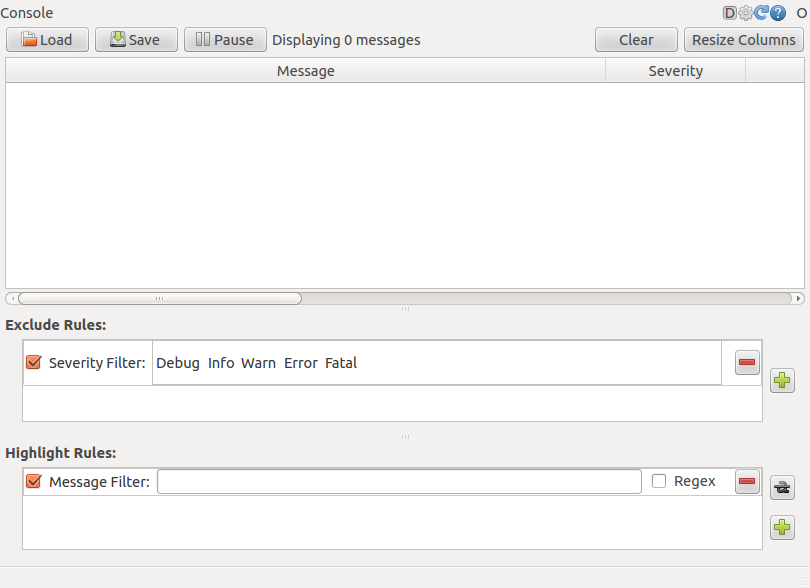
rqt_console attaches to ROS's logging framework to display output from nodes. rqt_logger_level allows us to change the verbosity level (DEBUG, WARN, INFO, and ERROR) of nodes as they run. Now let's look at the turtlesim output in rqt_console and switch logger levels in rqt_logger_level as we use turtlesim. Before we start the turtlesim, in two new terminals start rqt_console and rqt_logger_level: $ rosrun rqt_console rqt_console
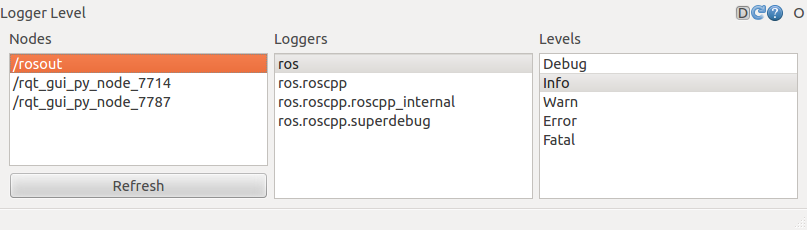
$ rosrun rqt_logger_level rqt_logger_level
You will see two windows popup:
Now let's start turtlesim in a new terminal: $ rosrun turtlesim turtlesim_node
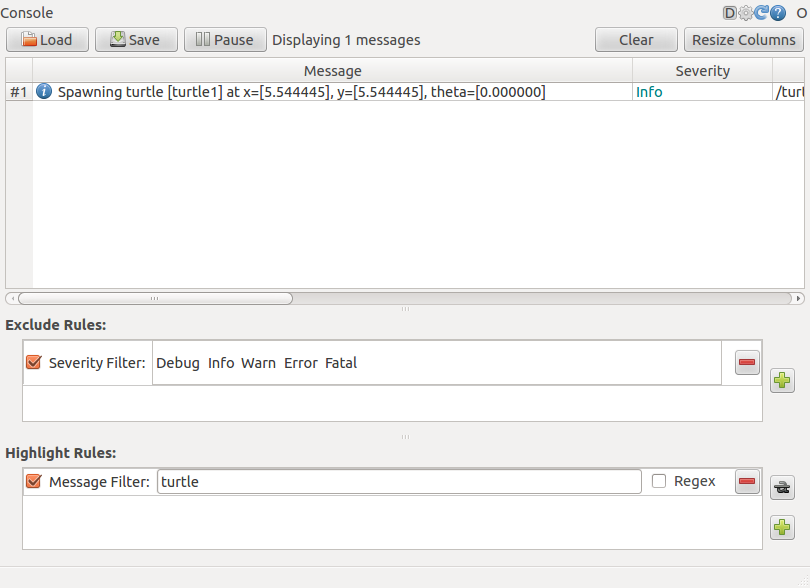
Since the default logger level is INFO you will see any info that the turtlesim publishes when it starts up, which should look like:
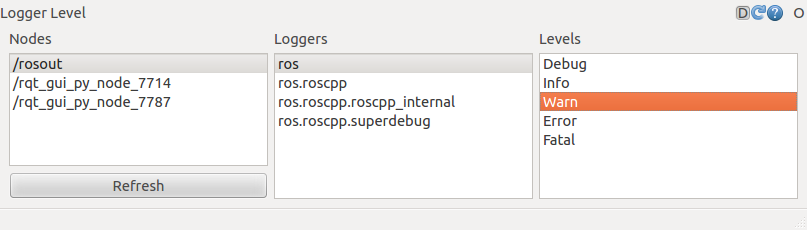
Now let's change the logger level to Warn by refreshing the nodes in the rqt_logger_level window and selecting Warn as shown below:
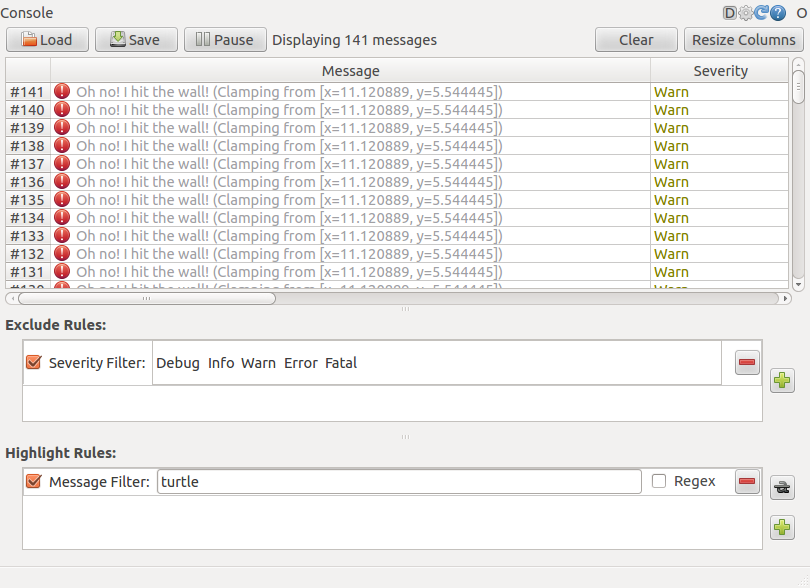
Now let's run our turtle into the wall and see what is displayed in our rqt_console: For ROS Hydro and later, rostopic pub /turtle1/cmd_vel geometry_msgs/Twist -r 1 -- '{linear: {x: 2.0, y: 0.0, z: 0.0}, angular: {x: 0.0,y: 0.0,z: 0.0}}'
For ROS Groovy and earlier, rostopic pub /turtle1/command_velocity turtlesim/Velocity -r 1 -- 2.0 0.0
[/code]

相关文章推荐
- VS2010和QT中编码不一样
- Qt树形控件QTreeView使用1——节点的添加删除操作
- QT学习 之 QwtPlot(数学绘图)
- UFT/QTP的工作原理
- Qt中库函数的隐式调用与显式调用
- 解决"应用程序无法启动,因为应用程序的并行配置不正确"的问题(VS2008 + qt)
- 搭建MQTT协议环境
- QtMainWindow菜单的使用
- qt中文乱码问题
- qt程序打包
- QT 绘图设备和Graphics View Framework
- qt+cdb调试配置
- Qt停止线程的方法
- Qt翻译---补充
- qt 共享内存(QSharedMemory)
- 自学QT之实现QMessageBox的按钮中文显示
- Qt入门学习——Qt快速入门(vim纯代码编写)
- Qt之界面实现技巧
- QT中文乱码的解
- MQTT介绍