nagios+pnp4nagios+nagiosql+nodutils
2015-11-16 15:59
267 查看
Nagios+PNP4nagios+Nagiosql+Ndoutils
Nagios是一款开源的电脑系统和网络监视工具,能有效监控Windows、Linux和Unix的主机状态,交换机路由器等网络设置,打印机等。在系统或服务状态异常时发出邮件或短信报警第一时间通知网站运维人员,在状态恢复后发出正常的邮件或短信通知。Nagios主要功能 网络服务监控(SMTP、POP3、HTTP、NNTP、ICMP、SNMP、FTP、SSH) 主机资源监控(CPU load、disk usage、system logs),也包括Windows主机(使用NSClient++ plugin 可以指定自己编写的Plugin通过网络收集数据来监控任何情况(温度、警告……)可以通过配置Nagios远程执行插件远程执行脚本远程监控支持SSH或SSL加通道方式进行监控简单的plugin设计允许用户很容易的开发自己需要的检查服务,支持很多开发语言(shell scripts、C++、Perl、ruby、Python、PHP、C#等)包含很多图形化数据Plugins(Nagiosgraph、Nagiosgrapher、PNP4Nagios等)可并行服务检查能够定义网络主机的层次,允许逐级检查,就是从父主机开始向下检查当服务或主机出现问题时发出通告,可通过email, pager, sms 或任意用户自定义的plugin进行通知能够自定义事件处理机制重新激活出问题的服务或主机自动日志循环支持冗余监控包括Web界面可以查看当前网络状态,通知,问题历史,日志文件Nagios工作原理Nagios的功能是监控服务和主机,但是他自身并不包括这部分功能,所有的监控、检测功能都是通过各种插件来完成的。启动Nagios后,它会周期性的自动调用插件去检测服务器状态,同时Nagios会维持一个队列,所有插件返回来的状态信息都进入队列,Nagios每次都从队首开始读取信息,并进行处理后,把状态结果通过web显示出来。Nagios提供了许多插件,利用这些插件可以方便的监控很多服务状态。安装完成后,在nagios主目录下的/libexec里放有nagios自带的可以使用的所有插件,如,check_disk是检查磁盘空间的插件,check_load是检查CPU负载的,等等。每一个插件可以通过运行./check_xxx –h 来查看其使用方法和功能。Nagios可以识别4种状态返回信息,即 0(OK)表示状态正常/绿色、1(WARNING)表示出现警告/黄色、2(CRITICAL)表示出现非常严重的错误/红色、3(UNKNOWN)表示未知错误/深黄色。Nagios根据插件返回来的值,来判断监控对象的状态,并通过web显示出来,以供管理员及时发现故障。四种监控状态

再说报警功能,如果监控系统发现问题不能报警那就没有意义了,所以报警也是nagios很重要的功能之一。但是,同样的,Nagios 自身也没有报警部分的代码,甚至没有插件,而是交给用户或者其他相关开源项目组去完成的。Nagios 安装,是指基本平台,也就是Nagios软件包的安装。它是监控体系的框架,也是所有监控的基础。打开Nagios官方的文档,会发现Nagios基本上没有什么依赖包,只要求系统是Linux或者其他Nagios支持的系统。不过如果你没有安装apache(http服务),那么你就没有那么直观的界面来查看监控信息了,所以apache姑且算是一个前提条件。关于apache的安装,网上有很多,照着安装就是了。安装之后要检查一下是否可以正常工作。知道Nagios 是如何通过插件来管理服务器对象后,现在开始研究它是如何管理远端服务器对象的。Nagios 系统提供了一个插件NRPE。Nagios 通过周期性的运行它来获得远端服务器的各种状态信息。它们之间的关系如下图所示:
Nagios 通过NRPE 来远端管理服务1). Nagios 执行安装在它里面的check_nrpe 插件,并告诉check_nrpe 去检测哪些服务。2). 通过SSL,check_nrpe 连接远端机子上的NRPE daemon3). NRPE 运行本地的各种插件去检测本地的服务和状态(check_disk,..etc)4).最后,NRPE 把检测的结果传给主机端的check_nrpe,check_nrpe 再把结果送到Nagios状态队列中。5). Nagios 依次读取队列中的信息,再把结果显示出来。一: 安装配置nagiosnagios服务器端所需安装的软件:
1.首先安装下面的包:
2.接着我们再安装下面的包
yum install httpd gd gd-devel php php-mysql mysql-devel mysql mysql-server gcc glibc glibc-common
注:原机器有的包,可以通过rpm -qa|grep 包名 检查下,如有上述包的可以不装。
3.添加nagios运行所需的用户和组
groupadd nagcmd
useradd -G nagcmd nagios
passwd nagios
4.把apache也添加到nagcmd的组里
usermod-a -G nagcmd apache
5.编译安装nagios
tar -zxvf nagios-3.5.1.tar.gz
./configure
--with-command-group=nagcmd --enable-event-broker
*** Configuration summary for nagios 3.5.1 08-30-2013 ***:
General Options:
-------------------------
Nagios executable: nagios
Nagios user/group: nagios,nagios
Command user/group: nagios,nagcmd
Embedded Perl: no
Event Broker: yes
Install ${prefix}: /usr/local/nagios
Lock file: ${prefix}/var/nagios.lock
Check result directory: ${prefix}/var/spool/checkresults
Init directory: /etc/rc.d/init.d
Apache conf.d directory: /etc/httpd/conf.d
Mail program: /bin/mail
Host OS: linux-gnu
Web Interface Options:
------------------------
HTML URL: http://localhost/nagios/ CGI URL: http://localhost/nagios/cgi-bin/ Traceroute (used by WAP): /bin/traceroute
Review the options above for accuracy. If they look okay,
type 'make all' to compile the main program and CGIs.
make all#编译所有
*** Compile finished ***
If the main program and CGIs compiled without any errors, you
can continue with installing Nagios as follows (type 'make'
without any arguments for a list of all possible options):
make install
- This installs the main program, CGIs, and HTML files
make install-init
- This installs the init script in /etc/rc.d/init.d
make install-commandmode
- This installs and configures permissions on the
directory for holding the external command file
make install-config
- This installs *SAMPLE* config files in /usr/local/nagios/etc
You'll have to modify these sample files before you can
use Nagios. Read the HTML documentation for more info
on doing this. Pay particular attention to the docs on
object configuration files, as they determine what/how
things get monitored!
make install-webconf
- This installs the Apache config file for the Nagios
web interface
make install-exfoliation
- This installs the Exfoliation theme for the Nagios
web interface
make install-classicui
- This installs the classic theme for the Nagios
web interface
*** Support Notes *******************************************
If you have questions about configuring or running Nagios,
please make sure that you:
- Look at the sample config files
- Read the documentation on the Nagios Library at: http://library.nagios.com before you post a question to one of the mailing lists.
Also make sure to include pertinent information that could
help others help you. This might include:
- What version of Nagios you are using
- What version of the plugins you are using
- Relevant snippets from your config files
- Relevant error messages from the Nagios log file
For more information on obtaining support for Nagios, visit: http://support.nagios.com *************************************************************
Enjoy.
make
install#安装
*** Main program, CGIs and HTML files installed ***
You can continue with installing Nagios as follows (type 'make'
without any arguments for a list of all possible options):
make install-init
- This installs the init script in /etc/rc.d/init.d
make install-commandmode
- This installs and configures permissions on the
directory for holding the external command file
make install-config
- This installs sample config files in /usr/local/nagios/etc
make[1]: Leaving directory `/usr/local/src/nagios'
make install-init#安装开机启动脚本
[root@localhost nagios]# make install-init
/usr/bin/install -c -m 755 -d -o root -g root /etc/rc.d/init.d
/usr/bin/install -c -m 755 -o root -g root daemon-init /etc/rc.d/init.d/nagios
*** Init script installed ***
make
install-commandmode#安装命令模式
[root@localhost nagios]# make install-commandmode
/usr/bin/install -c -m 775 -o nagios -g nagcmd -d /usr/local/nagios/var/rw
chmod g+s /usr/local/nagios/var/rw
*** External command directory configured ***
make
install-config#安装生成配置文件
*** Config files installed ***
Remember, these are *SAMPLE* config files. You'll need to read
the documentation for more information on how to actually define
services, hosts, etc. to fit your particular needs.
make
install-webconf#创建与apache关联
[root@localhost nagios]# make install-webconf
/usr/bin/install -c -m 644 sample-config/httpd.conf /etc/httpd/conf.d/nagios.conf
*** Nagios/Apache conf file installed ***
make
install-exfoliation#服务器接口主题
[root@localhost nagios]# make install-exfoliation
cp -rf contrib/exfoliation/stylesheets/* /usr/local/nagios/share/stylesheets
cp -rf contrib/exfoliation/images/* /usr/local/nagios/share/images
6.关闭 selinux
6.1编辑配置文件#永久生效,重启机器后也有效,需要重启机器
vim /etc/sysconfig/selinux
# This file controls the state of SELinux on the system.
# SELINUX= can take one of these three values:
# enforcing - SELinux security policy is enforced.
# permissive - SELinux prints warnings instead of enforcing.
# disabled - No SELinux policy is loaded.
SELINUX=disabled#把这行的改成disabled
# SELINUXTYPE= can take one of these two values:
# targeted - Targeted processes are protected,
# mls - Multi Level Security protection.
SELINUXTYPE=targeted
6.2写进内核,立即生效,重启机器后会失效
setenforce 0
7.创建密码认证文件
htpasswd -c /usr/local/nagios/etc/htpasswd.users nagiosadmin#创建用于web的登录的文件
注:该命令的执行要到安装的nagios的目录下,这里是/usr/local/nagios
[root@localhost nagios]# htpasswd -c /usr/local/nagios/etc/htpasswd.users nagiosadmin
New password:
Re-type new password:
Adding password for user nagiosadmin
8. 启动服务
service httpd start
9.把nagios加入服务
chkconfig --add nagios#加为服务
chkconfig nagios on#设为开机启动
10.安装nagios-plugins
tar -zxvf nagios-plugins-1.4.15.tar.gz#解压文件
./configure --with-nagios-user=nagios --with-nagios-group=nagios #配置nagios插件
--with-apt-get-command:
--with-ping6-command: /bin/ping6 -n -U -w %d -c %d %s
--with-ping-command: /bin/ping -n -U -w %d -c %d %s
--with-ipv6: yes
--with-mysql: /usr/bin/mysql_config
--with-openssl: yes
--with-gnutls: no
--enable-extra-opts: no
--with-perl: /usr/bin/perl
--enable-perl-modules: no
--with-cgiurl: /nagios/cgi-bin
--with-trusted-path: /bin:/sbin:/usr/bin:/usr/sbin
--enable-libtap: no
make&&make install#编译安装
/usr/bin/install -c -o nagios -g nagios 'check_breeze' '/usr/local/nagios/libexec/check_breeze'
/usr/bin/install -c -o nagios -g nagios 'check_disk_smb' '/usr/local/nagios/libexec/check_disk_smb'
/usr/bin/install -c -o nagios -g nagios 'check_flexlm' '/usr/local/nagios/libexec/check_flexlm'
/usr/bin/install -c -o nagios -g nagios 'check_ircd' '/usr/local/nagios/libexec/check_ircd'
/usr/bin/install -c -o nagios -g nagios 'check_log' '/usr/local/nagios/libexec/check_log'
/usr/bin/install -c -o nagios -g nagios 'check_oracle' '/usr/local/nagios/libexec/check_oracle'
/usr/bin/install -c -o nagios -g nagios 'check_rpc' '/usr/local/nagios/libexec/check_rpc'
/usr/bin/install -c -o nagios -g nagios 'check_sensors' '/usr/local/nagios/libexec/check_sensors'
/usr/bin/install -c -o nagios -g nagios 'check_wave' '/usr/local/nagios/libexec/check_wave'
/usr/bin/install -c -o nagios -g nagios 'check_ifstatus' '/usr/local/nagios/libexec/check_ifstatus'
/usr/bin/install -c -o nagios -g nagios 'check_ifoperstatus' '/usr/local/nagios/libexec/check_ifoperstatus'
/usr/bin/install -c -o nagios -g nagios 'check_mailq' '/usr/local/nagios/libexec/check_mailq'
/usr/bin/install -c -o nagios -g nagios 'check_file_age' '/usr/local/nagios/libexec/check_file_age'
/usr/bin/install -c -o nagios -g nagios 'utils.sh' '/usr/local/nagios/libexec/utils.sh'
/usr/bin/install -c -o nagios -g nagios 'utils.pm' '/usr/local/nagios/libexec/utils.pm'
装完/usr/local/nagios/libexec目录下应该有下面的一些插件
[root@localhost libexec]# ls
check_apt check_disk_smb check_ide_smart check_mailq check_nt check_pop check_ssh check_wave
check_breeze check_dns check_ifoperstatus check_mrtg check_ntp check_procs check_ssmtp negate
check_by_ssh check_dummy check_ifstatus check_mrtgtraf check_ntp_peer check_real check_swap urlize
check_clamd check_file_age check_imap check_mysql check_ntp_time check_rpc check_tcp utils.pm
check_cluster check_flexlm check_ircd check_mysql_query check_nwstat check_sensors check_time utils.sh
check_dhcp check_ftp check_jabber check_nagios check_oracle check_simap check_udp
check_dig check_http check_load check_nntp check_overcr check_smtp check_ups
check_disk check_icmp check_log check_nntps check_ping check_spop check_users
11.登录nagios界面
注:要关闭主机防火墙,或者在防火墙中开放主机web的访问端口。
在浏览器中输入http://服务器IP/nagios,输入nagiosadmin,和刚才设置的密码。
安装成功。
12.安装nrpe#nagios监控远程的linux机器一般用nrpe,所以我们这边装nrpe这个插件,要说的一点是nagios服务器只需安装nrpe 插件,不需要启用nrpe demon也就是守护进程。并且nrpe不需要启动服务的。
tar -zxvf nrpe-2.15.tar.gz
./configure --with-nrpe-user=nagios \
> --with-nrpe-group=nagios \
> --with-nagios-user=nagios \
> --with-nagios-group=nagios \
> --enable-command-args \#该命令必须加,需要使用nrpe后面加参数
> --enable-ssl
*** Configuration summary for nrpe 2.15 09-06-2013 ***:
General Options:
-------------------------
NRPE port: 5666
NRPE user: nagios
NRPE group: nagios
Nagios user: nagios
Nagios group: nagios
Review the options above for accuracy. If they look okay,
type 'make all' to compile the NRPE daemon and client.
make all *** Compile finished ***
If the NRPE daemon and client compiled without any errors, you
can continue with the installation or upgrade process.
Read the PDF documentation (NRPE.pdf) for information on the next
steps you should take to complete the installation or upgrade.
make
install-plugin
[root@localhost nrpe-2.15]# make install-plugin
cd ./src/ && make install-plugin
make[1]: Entering directory `/usr/local/src/nrpe-2.15/src'
/usr/bin/install -c -m 775 -o nagios -g nagios -d /usr/local/nagios/libexec
/usr/bin/install -c -m 775 -o nagios -g nagios check_nrpe /usr/local/nagios/libexec
make[1]: Leaving directory `/usr/local/src/nrpe-2.15/src'
nagios客户端所需安装的软件(被监控机器上):
1.使用yum安装所需的开发工具和开发库等包
yum -y groupinstall "Development Tools" "Development Libraries"
2.添加nagios用户
useradd -s /sbin/nologin nagios
3.安装配置nagios-plugins
./configure --with-nagios-user=nagios --with-nagios-group=nagios
make all
make install
4.安装配置nrpe
./configure --with-nrpe-user=nagios \
--with-nrpe-group=nagios \
--with-nagios-user=nagios \
--with-nagios-group=nagios \
--enable-command-args \
--enable-ssl
make all#编译所有
make install-plugin#安装nrpe主程序
make install-daemon#安装nrpe的守护进程
make install-daemon-config#安装nrpe配置文件
cd /usr/local/nagios/etc
编辑nrpe.cfg文件,把nagios服务器的IP地址加入允许的主机中,并把要监控的服务等参数添加到nrpe.cfg中。
allowed_hosts=127.0.0.1,172.30.20.51#允许的nagios服务器地址
dont_blame_nrpe=1#允许命令后接一些参数
command[check_users]=/usr/local/nagios/libexec/check_users -w 5 -c 10#监控的服务示例
5.启动nrpe
/usr/local/nagios/bin/nrpe -c /usr/local/nagios/etc/nrpe.cfg -d#启动nrpe服务
注意:客户端的主机防火墙必须关闭或者放开对5666端口的访问的限制。
在nagios服务器的libexec的插件目录中,检测nagios客户机。
[root@localhost libexec]# ./check_nrpe -H 192.168.1.10
NRPE v2.15#测试成功
二: 安装配置pnp4nagios
Pnp4nagios使用的是RRDtool工具来实现画图的,使监控界面显得更丰富多彩。
pnp4nagios原理图(Bulk Mode with NPCD)
1).执行插件
2).把Perfdata里的数据存储到Spool文件里
3).把SpoolFile文件挪到Spool目录里
4).扫描Spool目录
5).执行Perfdata命令
6).更行rrd数据库
7).写入xml数据
8).生成php网页文件
pnp4nagios是一个基于php和perl,用rrdtool将nagios采集的数据绘制图表的工具,
1.这里我们先安装rrdtool,由于系统已用yum安装rrdtool,这里已经使用yum,安装了rrdtool
[root@BestTone-zabbix ssi]# rpm -qa|grep rrdtool
rrdtool-1.3.8-7.el6.x86_64
[root@BestTone-zabbix ssi]# ll /usr/bin/rrdtool
-rwxr-xr-x. 1 root root 35192 4月 3 2014 /usr/bin/rrdtool
2.安装pnpnagios
tar -zxvf pnp4nagios-0.6.25.tar.gz
./configure --with-nagios-user=nagios
--with-nagios-group=nagios --with-rrdtool=/usr/bin/rrdtool#指定rrdtool的路径
*** Configuration summary for pnp4nagios-0.6.25 03-01-2015 ***
General Options:
------------------------- -------------------
Nagios user/group: nagios nagios
Install directory: /usr/local/pnp4nagios
HTML Dir: /usr/local/pnp4nagios/share
Config Dir: /usr/local/pnp4nagios/etc
Location of rrdtool binary: /usr/local/rrdtool/bin/rrdtool Version 1.4.8
RRDs Perl Modules: FOUND (Version 1.3008)
RRD Files stored in: /usr/local/pnp4nagios/var/perfdata
process_perfdata.pl Logfile: /usr/local/pnp4nagios/var/perfdata.log
Perfdata files (NPCD) stored in: /usr/local/pnp4nagios/var/spool
Web Interface Options:
------------------------- -------------------
HTML URL: http://localhost/pnp4nagios Apache Config File: /etc/httpd/conf.d/pnp4nagios.conf
Review the options above for accuracy. If they look okay,
type 'make all' to compile.
make all
*** Compile finished ***
make install
- This installs the main program and HTML files
make fullinstall
- This installs the main program, runlevel scripts, config and HTML files
Enjoy.
make
install#普通安装
*** Main program, Scripts and HTML files installed ***
Please run 'make install-webconf' to install the
web configuration file
Please run 'make install-config' to install sample
configuration files
Please run 'make install-init' if you want to use
BULK Mode with NPCD
make
install-webconf#安装web接口配置文件,关联apache
*** Apache config file installed ***
Restart your apache webserver to activete your changes.
Please run 'make install-config' to install sample
configuration files
Please run 'make install-init' if you want to use
BULK Mode with NPCD
make
install-config#安装pnp4nagios配置文件
*** PNP4Nagios sample config files installed ***
Please run 'make install-init' if you want to use
BULK Mode with NPCD
make
install-init#安装启动脚本,可以直接使用npcd的方式启动
[root@localhost pnp4nagios-0.6.25]# make install-init
cd ./scripts && make install-init
make[1]: Entering directory `/usr/local/src/pnp4nagios-0.6.25/scripts'
/usr/bin/install -c -m 755 -o root -g root -d /etc/rc.d/init.d
/usr/bin/install -c -m 755 -o root -g root rc.npcd /etc/rc.d/init.d/npcd
/usr/bin/install -c -m 755 -o root -g root rc.pnp_gearman_worker /etc/rc.d/init.d/pnp_gearman_worker
make[1]: Leaving directory `/usr/local/src/pnp4nagios-0.6.25/scripts'
注意:也可以在上面的配置完的选项中直接make fullinstall
3. 进入到pnp4nagios的目录/usr/local/pnp4nagios/etc中,把相关后缀带sample文件变更成无sample后缀
例如:mv web_traffic.cfg-sample web_traffic.cfg
4.配置Nagios来启用PNP4nagios
pnp4nagios有五种工作模式,常用的有三种
5.如下图所示:
5.1.Synchronous Mode

nagios.cfg 文件里改
process_performance_data=1
enable_environment_macros=1
service_perfdata_command=process-service-perfdata
host_perfdata_command=process-host-perfdata
command.cfg文件里改
define command {
command_name process-service-perfdata
command_line /usr/bin/perl /usr/local/pnp4nagios/libexec/process_perfdata.pl
}
define command {
command_name process-host-perfdata
command_line /usr/bin/perl /usr/local/pnp4nagios/libexec/process_perfdata.pl -d HOSTPERFDATA
}
注:template.cfg和定义的host.cfg里要把添加的主机模板和服务模板都加进去。这里我先介绍下几种模式。具体的模板和主机的改法我会在下面介绍。
5.2.Bulk Mode

nagios.cfg里改
注意:下面的改法,可以在原本注释的文件里去掉注释,也可以直接复制过来加在文件的最后面。
process_performance_data=1
#
# service performance data
#
service_perfdata_file=/usr/local/pnp4nagios/var/service-perfdata
service_perfdata_file_template=DATATYPE::SERVICEPERFDATA\tTIMET::$TIMET$\tHOSTNAME::$HOSTNAME$\tSERVICEDESC::$SERVICEDESC$\tSERVICEPERFDATA::$SERVICEPERFDATA$\tSERVICECHECKCOMMAND::$SERVICECHECKCOMMAND$\tHOSTSTATE::$HOSTSTATE$\tHOSTSTATETYPE::$HOSTSTATETYPE$\tSERVICESTATE::$SERVICESTATE$\tSERVICESTATETYPE::$SERVICESTATETYPE$
service_perfdata_file_mode=a
service_perfdata_file_processing_interval=15
service_perfdata_file_processing_command=process-service-perfdata-file
#
# host performance data starting with Nagios 3.0
#
host_perfdata_file=/usr/local/pnp4nagios/var/host-perfdata
host_perfdata_file_template=DATATYPE::HOSTPERFDATA\tTIMET::$TIMET$\tHOSTNAME::$HOSTNAME$\tHOSTPERFDATA::$HOSTPERFDATA$\tHOSTCHECKCOMMAND::$HOSTCHECKCOMMAND$\tHOSTSTATE::$HOSTSTATE$\tHOSTSTATETYPE::$HOSTSTATETYPE$
host_perfdata_file_mode=a
host_perfdata_file_processing_interval=15
host_perfdata_file_processing_command=process-host-perfdata-file
commands.cfg里改
define command{
command_name process-service-perfdata-file
command_line /usr/local/pnp4nagios/libexec/process_perfdata.pl --bulk=/usr/local/pnp4nagios/var/service-perfdata
}
define command{
command_name process-host-perfdata-file
command_line /usr/local/pnp4nagios/libexec/process_perfdata.pl --bulk=/usr/local/pnp4nagios/var/host-perfdata
}
5.3.Bulk Mode with NPCD

process_performance_data=1
#
# service performance data
#
service_perfdata_file=/usr/local/pnp4nagios/var/service-perfdata
service_perfdata_file_template=DATATYPE::SERVICEPERFDATA\tTIMET::$TIMET$\tHOSTNAME::$HOSTNAME$\tSERVICEDESC::$SERVICEDESC$\tSERVICEPERFDATA::$SERVICEPERFDATA$\tSERVICECHECKCOMMAND::$SERVICECHECKCOMMAND$\tHOSTSTATE::$HOSTSTATE$\tHOSTSTATETYPE::$HOSTSTATETYPE$\tSERVICESTATE::$SERVICESTATE$\tSERVICESTATETYPE::$SERVICESTATETYPE$
service_perfdata_file_mode=a
service_perfdata_file_processing_interval=15
service_perfdata_file_processing_command=process-service-perfdata-file
#
# host performance data starting with Nagios 3.0
#
host_perfdata_file=/usr/local/pnp4nagios/var/host-perfdata
host_perfdata_file_template=DATATYPE::HOSTPERFDATA\tTIMET::$TIMET$\tHOSTNAME::$HOSTNAME$\tHOSTPERFDATA::$HOSTPERFDATA$\tHOSTCHECKCOMMAND::$HOSTCHECKCOMMAND$\tHOSTSTATE::$HOSTSTATE$\tHOSTSTATETYPE::$HOSTSTATETYPE$
host_perfdata_file_mode=a
host_perfdata_file_processing_interval=15
host_perfdata_file_processing_command=process-host-perfdata-file
command.cfg更改
define command{
command_name process-service-perfdata-file
command_line /bin/mv /usr/local/pnp4nagios/var/service-perfdata /usr/local/pnp4nagios/var/spool/service-perfdata.$TIMET$
}
define command{
command_name process-host-perfdata-file
command_line /bin/mv /usr/local/pnp4nagios/var/host-perfdata /usr/local/pnp4nagios/var/spool/host-perfdata.$TIMET$
}
npcd启动方式: /usr/local/pnp4nagios/bin/npcd -d -f /usr/local/pnp4nagios/etc/npcd.cfg
5.4.Bulk Mode with NPCD and npcdmod
5.5.Gearman Mode
这两种模式就先不介绍了,一般用不到。想了解的话,详见官网:https://docs.pnp4nagios.org/pnp-0.6/config
6.这里我们选用Bulk 模式。介绍主机和服务出图的需要配置的相关步骤:
1).执行插件
2).把perfdata里的数据存储到Spool文件中
3).执行Pferdata 命令
4).读取Spool文件
5).更新rrd数据库
6).写入xml数据
7).更新做展示的php文件
6.1 定义模式
在/usr/local/nagios/etc下面修改nagios.cfg文件。在nagios.cfg里启用下面的配置(其实在/usr/local/pnp4nagios/etc下的nagios.cfg的文件里已经有了对bulk等模式的定义,我们打开nagios.cfg的文件看看。注意:是在/usr/local/pnp4nagios/etc下的nagios.cfg)
#
# Bulk / NPCD mode
#
process_performance_data=1
# *** the template definition differs from the one in the original nagios.cfg
#
service_perfdata_file=/usr/local/pnp4nagios/var/service-perfdata
service_perfdata_file_template=DATATYPE::SERVICEPERFDATA\tTIMET::$TIMET$\tHOSTNAME::$HOSTNAME$\tSERVICEDESC::$SERVICEDESC$\tSERVICEPERFDATA::$SERVICEPERFDATA$\tSERVICECHECKCOMMAND::$SERVICECHECKCOMMAND$\tHOSTSTATE::$HOSTSTATE$\tHOSTSTATETYPE::$HOSTSTATETYPE$\tSERVICESTATE::$SERVICESTATE$\tSERVICESTATETYPE::$SERVICESTATETYPE$
service_perfdata_file_mode=a
service_perfdata_file_processing_interval=15
service_perfdata_file_processing_command=process-service-perfdata-file
# *** the template definition differs from the one in the original nagios.cfg
#
host_perfdata_file=/usr/local/pnp4nagios/var/host-perfdata
host_perfdata_file_template=DATATYPE::HOSTPERFDATA\tTIMET::$TIMET$\tHOSTNAME::$HOSTNAME$\tHOSTPERFDATA::$HOSTPERFDATA$\tHOSTCHECKCOMMAND::$HOSTCHECKCOMMAND$\tHO
STSTATE::$HOSTSTATE$\tHOSTSTATETYPE::$HOSTSTATETYPE$
host_perfdata_file_mode=a
host_perfdata_file_processing_interval=15
host_perfdata_file_processing_command=process-host-perfdata-file
6.2 定义命令
修改 /usr/local/nagios/etc/commands.cfg文件,命令如下
注意:这两个命令可以定义到配置文件的最下面,把本来机器上带的# 'process-host-perfdata' command definition 注释掉
#
# Bulk mode
#
define command {
command_name process-service-perfdata-file
command_line /usr/local/pnp4nagios/libexec/process_perfdata.pl --bulk /usr/local/pnp4nagios/var/service-perfdata
}
define command {
command_name process-host-perfdata-file
command_line /usr/local/pnp4nagios/libexec/process_perfdata.pl --bulk /usr/local/pnp4nagios/var/host-perfdata
}
6.3 定义模板
然后修改/usr/local/nagios/etc/templates.cfg文件,定义主机模板和服务模板,把下面所示的配置加入到templates.cfg的最下面。
define host {
name host-pnp
action_url /pnp4nagios/graph?host=$HOSTNAME$&srv=_HOST_' class='tips' rel='/pnp4nagios/popup?host=$HOSTNAME$&srv=_HOST_
register 0
}
define service {
name srv-pnp
action_url /pnp4nagios/graph?host=$HOSTNAME$&srv=$SERVICEDESC$' class='tips' rel='/pnp4nagios/popup?host=$HOSTNAME$&srv=$SERVICEDESC$
register 0
}
6.4 定义主机
这里以localhost主机为例,修改/usr/local/nagios/etc/localhost.cfg的配置文件
# Define a host for the local machine
define host{
use linux-server,host-pnp #加入主机模板
host_name localhost
alias localhost
address 127.0.0.1
}
# Define a service to "ping" the local machine
define service{
use local-service,srv-pnp#加入服务模板
host_name localhost
service_description PING
check_command check_ping!100.0,20%!500.0,60%
}
7.然后添加小太阳模版,镶嵌在nagios页面上.你只需要把鼠标移动到太阳图标上面就会自动弹出图形出来
cd /usr/local/src/pnp4nagios-0.6.25/contrib/ssi#进入到pnp4nagios源码目录
cp status-header.ssi /usr/local/nagios/share/ssi#拷贝status-header.ssi到/usr/local/nagios/share/ssi/目录下面来(这一步很重要,要不然移动到太阳标记上出不了图)
8.检查nagios配置并重启服务。
service npcd start
service nagios restart
service httpd restart
9.输入访问地址http://192.168.1.7/pnp4nagios,出现如下图所示界面
然后把/usr/local/pnp4nagios/share/install.php下面的install.php打成bak文件
过一段时间就出图了
效果如下图所示:
已经出图,证明pnp4nagios安装成功!
三: 安装配置nagiosql
NagiosQL
是专为nagios设计的web图形化管理应用,主要作用就是操作数据库和配置文件,其中包括将配置文件的信息写到数据库中,在数据库中修改Nagios
的监控配置信息,并将数据库中存放的配置更新到文件中。用户可以通过NagiosQL提供的Web页面直观的修改配置。实现架构很简单,功能很实用。
Nagiosql功能介绍:
1. 具有基本的nagios的配置管理能力,导入,导出配置文件的功能
2. 具有nagios配置文件检查、排错的能力
3. Nagiosql可对文件结构进行定制,可延续之前的配置结构,按IP生成配置
4. Nagiosql将每一次配置的变更做一次配置备份,以时间戳为后缀保存,理论上可以回滚到任意一个历史配置
NagiosQL项目地址:http://www.nagiosql.org/
1.下面我们来安装nagiosql
tar -zxvf nagiosql_311.tar.gz
mv nagiosql /usr/local/nagios/#把解压出来的文件,迁移到/usr/local/nagios/下面
2. 建立nagiosql导出nagios配置文件的目录并修改权限
mkdir -p /etc/nagiosql/{hosts,services,backup/{,hosts,services},import}chown -R apache:nagios /etc/nagiosql/chmod -R 755 /etc/nagiosqlchmod 777 /usr/local/nagios/nagiosql/config
3. Nagios相关文件权限的设定
chown nagios:apache /usr/local/nagios/etcchown nagios:apache /usr/local/nagios/etc/{nagios.cfg,cgi.cfg}chown nagios:apache /usr/local/nagios/etc/*chmod 664 /usr/local/nagios/etc/{nagios.cfg,cgi.cfg}chmod 775 /usr/local/nagios/etc
4. 设定nagios二进制文件的权限,以便其能够通过Web程序执行
chown nagios:apache /usr/local/nagios/bin/nagioschmod 750 /usr/local/nagios/bin/nagioschown -R apache.nagios /usr/local/nagios/var/spool/chown nagios:apache /usr/local/nagios/var/rw/nagios.cmdchmod 660 /usr/local/nagios/var/rw/nagios.cmd
5. 为apache添加nagiosQL虚拟目录
vim /etc/httpd/conf.d/nagios.conf 最后增加如下内容:Alias /nagiosQL "/usr/local/nagios/nagiosql" <Directory "/usr/local/nagios/nagiosql"> # SSLRequireSSL Options None AllowOverride None Order allow,deny Allow from all </Directory>
6. 建立nagiosql安装文件
touch /usr/local/nagios/nagiosql/install/ENABLE_INSTALLER
7. 重启httpd服务
service httpd restart
8.登录地址http://192.168.1.6/nagiosQL会看见出现下面nagiosql安装界面
注意:要启动mysql数据库,并设置mysql相应的登录帐号和权限。
进去把页面设置为中文,然后配置一些参数。
9. 登入管理界面
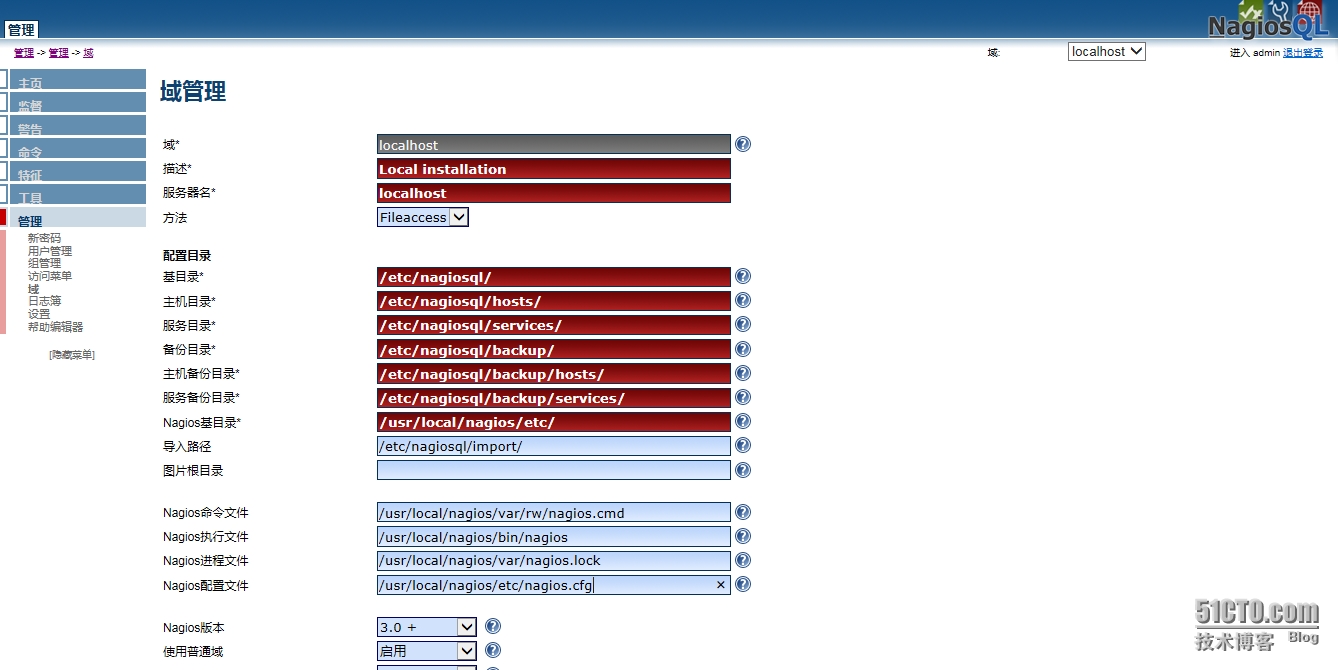
(1).管理域,配置对一些域的参数。
(2)工具-导入数据 右边会列出一些配置文件,选择导入即可。
导入只是把配置文件内容导入到Mysql数据库,而使用其配置文件时,是一个个cfg文件,所以下面要进行写入过程,写完并检查写入文件。
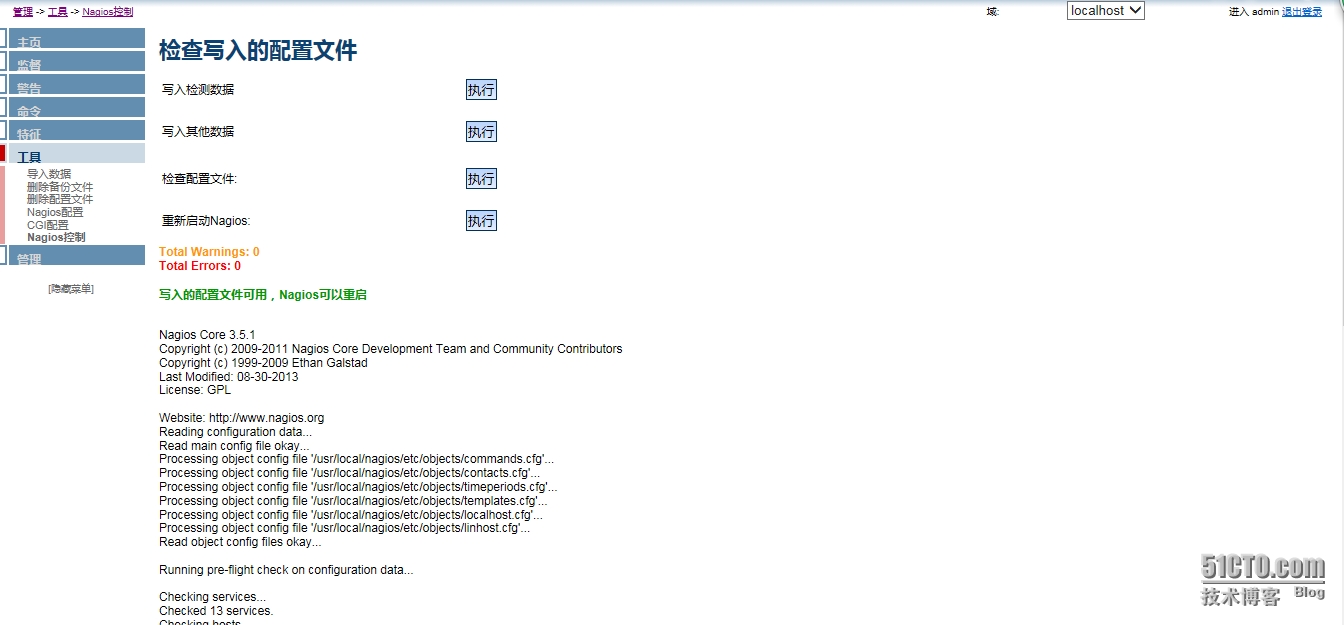
(3)检查配置并重启nagios
(4)写入之后就可以看到相应的cfg文件了,查看写入是否成功
ll /etc/nagiosql

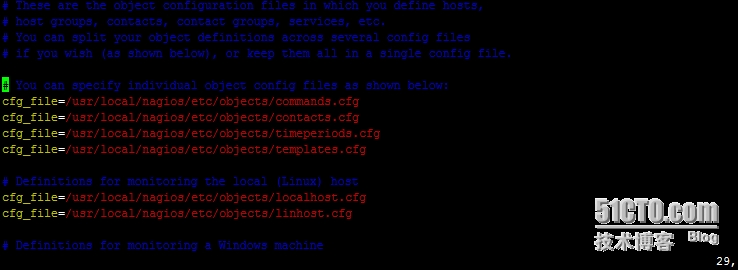
(5) 在/usr/local/nagios/etc/nagios.cfg配置文件里,将原有以cfg_file开头项全部注释掉,加入新的配置文件路径
cfg_dir=/etc/nagiosql/hosts/
cfg_dir=/etc/nagiosql/services/
cfg_file=/etc/nagiosql/commands.cfg
cfg_file=/etc/nagiosql/contactgroups.cfg
cfg_file=/etc/nagiosql/contacts.cfg
cfg_file=/etc/nagiosql/contacttemplates.cfg
cfg_file=/etc/nagiosql/hostdependencies.cfg
cfg_file=/etc/nagiosql/hostescalations.cfg
cfg_file=/etc/nagiosql/hostextinfo.cfg
cfg_file=/etc/nagiosql/hostgroups.cfg
cfg_file=/etc/nagiosql/hosttemplates.cfg
cfg_file=/etc/nagiosql/servicedependencies.cfg
cfg_file=/etc/nagiosql/serviceescalations.cfg
cfg_file=/etc/nagiosql/serviceextinfo.cfg
cfg_file=/etc/nagiosql/servicegroups.cfg
cfg_file=/etc/nagiosql/servicetemplates.cfg
cfg_file=/etc/nagiosql/timeperiods.cfg

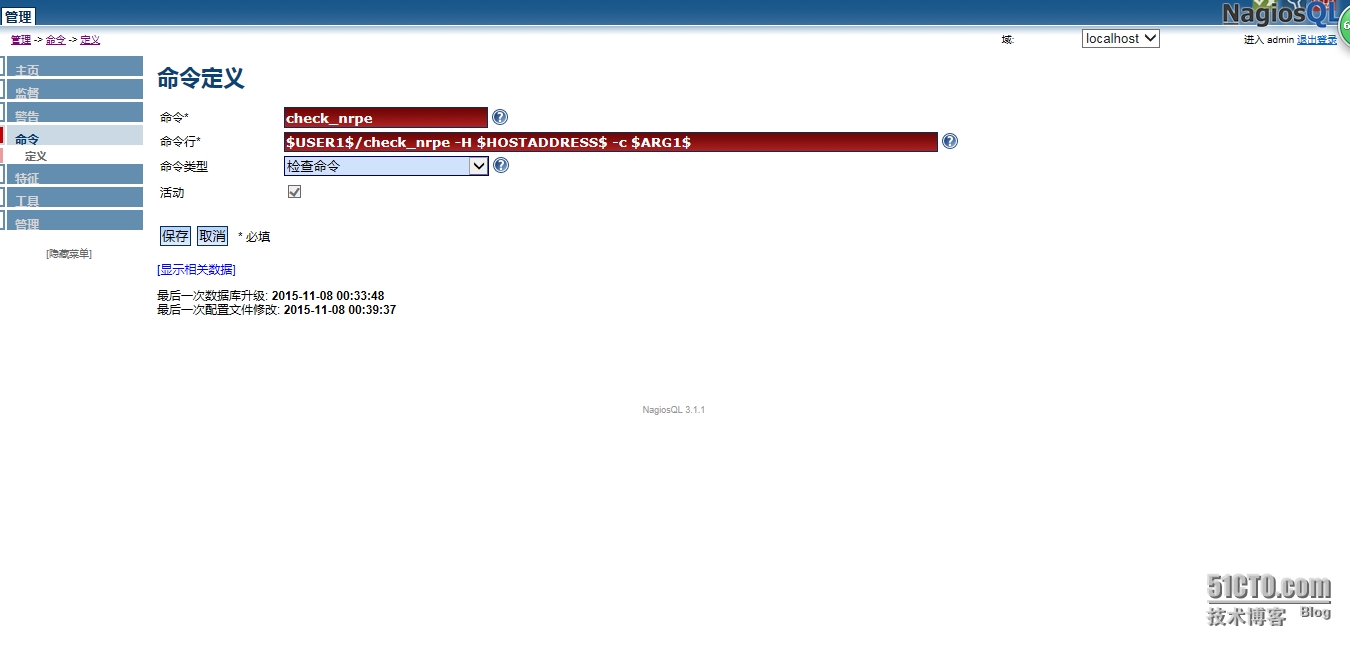
(6) 定义要监控的命令
例如:nrpe
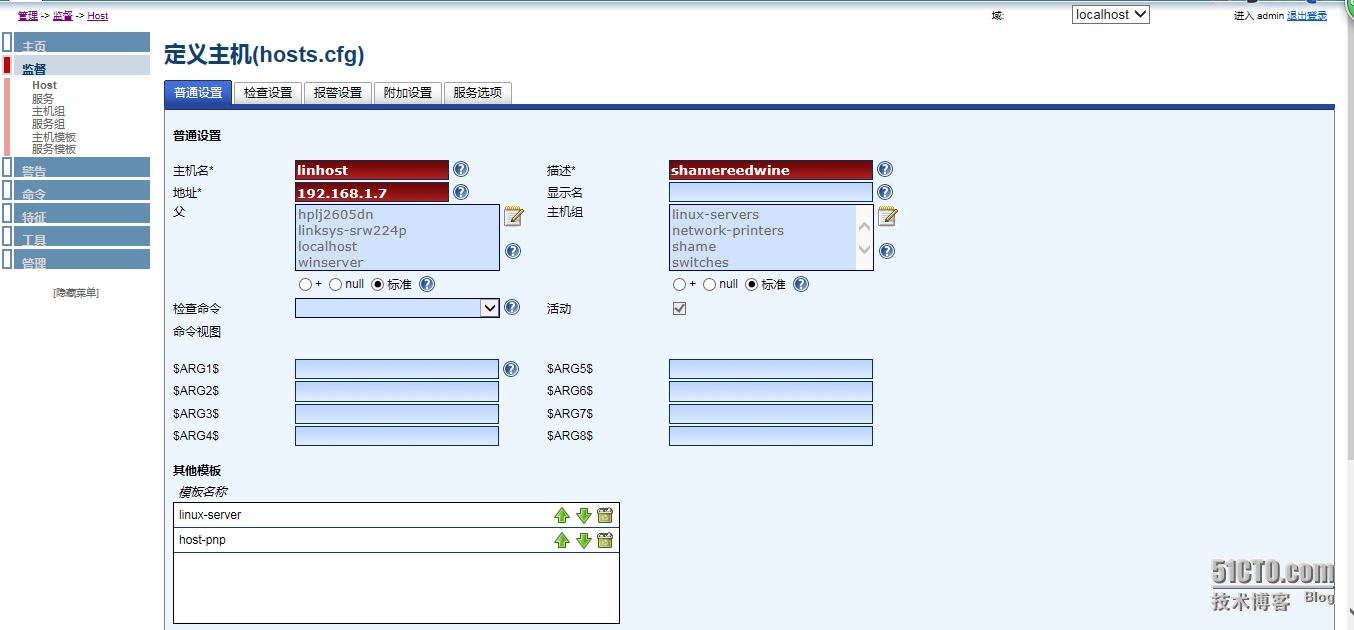
(7) 添加要监控的主机。
(8)添加要监控的服务
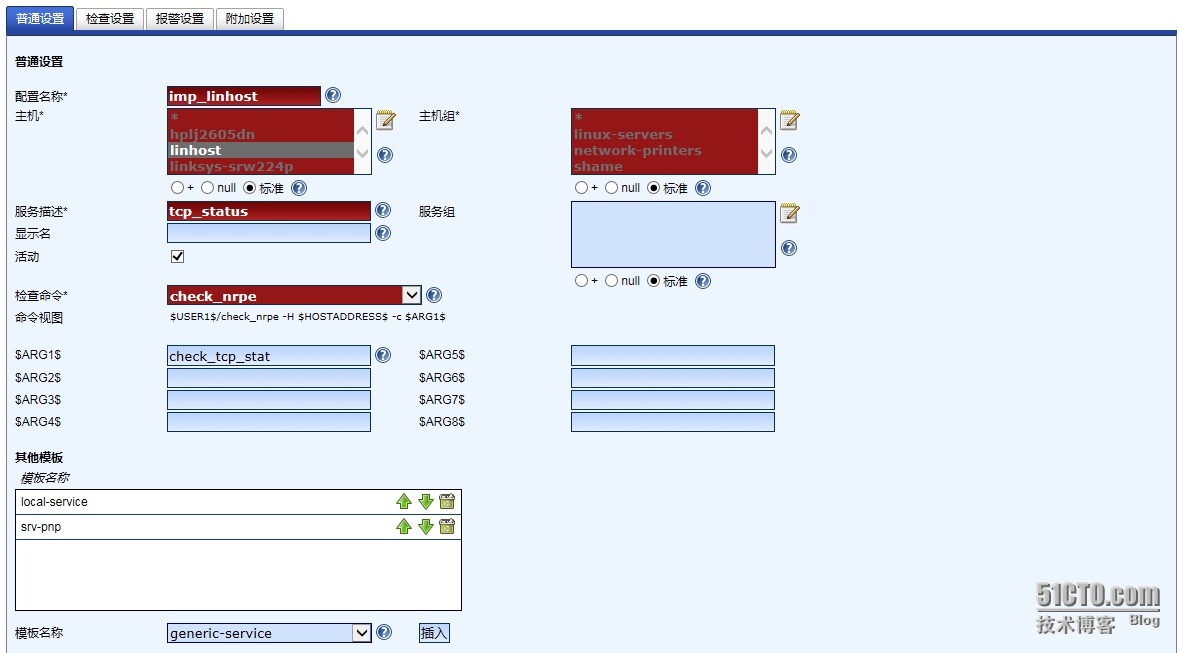
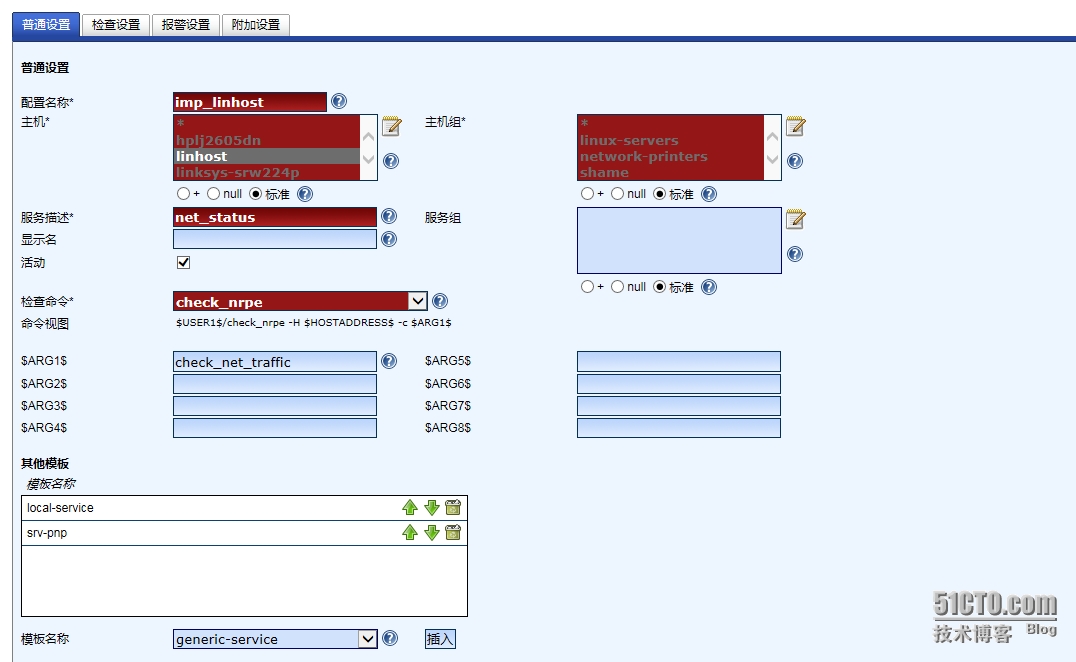

注意:主机的模板要加上host-pnp,服务的模板srv-pnp都要加上。监控端命令行配置的命令,要与被监控端的nrpe.cfg配置的文件一致。
(9) 重启nagios,看看显示效果。
先要导入配置:
然后点 “工具”-"nagios控制“再执行下图所示的几个步骤:
(10) 执行完,会有下图所示的效果:

(11)添加监控mysql数据库服务
mysql> create database nagdb defaultCHARSET=utf8;
Query OK, 1 row affected(0.01 sec)
mysql> grant select on nagdb.* to 'nagios'@'%';
Query OK, 0 rows affected (0.00 sec)
mysql> update mysql.user set password =password('nagios') where user='nagios';
Query OK, 2 rows affected (0.00 sec)
Rows matched: 2 Changed: 2 Warnings: 0
mysql> flush privileges;
Query OK, 0 rows affected (0.00 sec)
mysql> quit
Bye
[root@localhost libexec]# ./check_mysql -H127.0.0.1 -u nagios -d nagdb -p nagios;
Uptime: 150 Threads: 1 Questions: 8 Slow queries: 0 Opens: 15 Flush tables: 1 Open tables:8 Queries per second avg: 0.53
然后定义监控的命令
定义要监控的主机和服务
导入定义好的数据
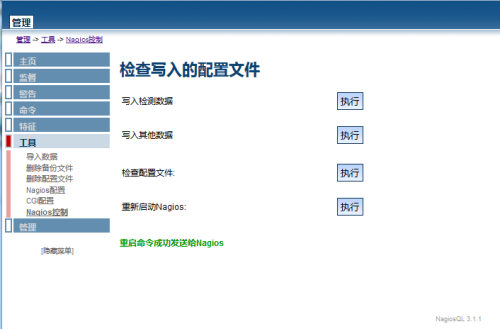
按照以下的几个步骤:写入检测数据、写入其他数据、检查配置文件、重启nagios
检测效果:
(12) 添加告警邮件设置:
先定义联系人
定义需监控的主机
定义需监控的服务
定义服务的一些参数
定义主机的一些参数
然后重启nagios服务
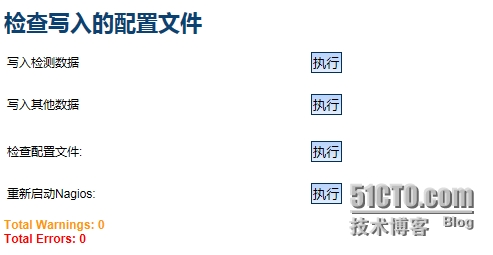
“工具”-》“Nagios控制”-》“检查写入的配置文件”下面的四个按钮按顺序执行一遍,如下图:
四: 安装配置ndoutils
NDOUtils简介
NDOUTILS ADDON主要用来将Nagios的配置信息和event产生的数据存入数据库
以方便实现数据的快速检索和处理,并且为其它通过web接口程序来管理这些数据提供了保障。
在一个大型应用中,可能存在多个独立的或分布式布置的Nagios服务器,这种环境中的每个Nagios服务器通常被称为一个Nagios实例。在多Nagios实例的环境中,既可以把所有实例的数据存入到一个数据库,也可以将各实例的数据分别存储。
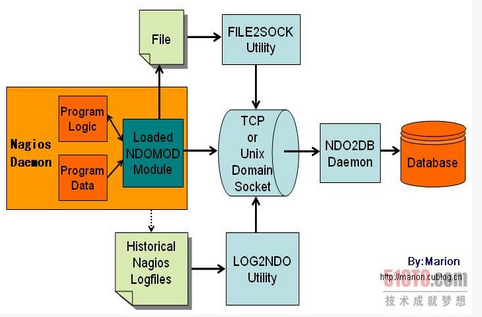
NDO Utils主要由以下四个部分组成:
1)NDOMOD Event Broker
Module(NDOMOD.O):用来输出Nagios进程产生的数据(data和logic),其前提是Nagios在编译时开启了Event
broker的功能。同时,NDOMOD模块还可以导出Nagios配置有关的信息(包括Nagios监控进程运行时环境产生的动态数据)至文件、
Unix域套接字或者TCP套接字。NDO2DB将通过前面的这三种方式获得Nagios的有关数据。
2)NDO2DB:用来接收由NDOMOD和LOG2NDO组件输出的信息并将之存储在数据库中。启动时,NDO2DB进程将创建一个TCP套接字或Unix域套接字以监听客户端(输出端)的连接请求。目前仅支持MySQL数据库。
多个客户端可以同时向一个NDO2DB守护进程输出数据,此时的NDO2DB将为每一个连接进来的客户端(Nagios实例)建立一个连接进程,以实现每个客户端数据的独立存储、检索和处理。
3)LOG2NDO:用来将Nagios的历史日志通过NDO2DB进程输出至数据库。LOG2NDO与NDO2DB进程通信的方法依然是标准文件、Unix域套接字或者TCP套接字三种。
4)FILE2SOCK:从标准文件或标准输入读入数据,并将之输出至Unix域套接字或TCP套接字。当NDOMOD或LOG2NDO将数据输出至标准文件时,此工具则可用来将这些标准文件中数据读出并发送给NDO2DB进程监听的TCP套接字或Unix域套接字。
下面我们来安装ndoutils,安装方法,使用源码编译
1.DBI的安装
到官网http://www.cpan.org/modules/by-module/DBI/ 下载
这里下载的是DBI-1.633.tar.gz
tar -zxvf DBI-1.633.tar.gz
cd DBI-1.633
perl Makefile.PL
make
make test
这里出现test错误,不用管他,继续安装。
make install
2. DBD的安装
DBD-mysql-4.025
tar -zxvfDBD-mysql-4.025.tar.gz
cd DBD-mysql-4.025
perl Makefile.PL --libs="-L/usr/lib64/mysql #mysql使用yum装的,检查配置时系统一般能找到头文件和库文件的位置,不用过多配置一些选项
make
make test
make install
3.NDOUTILS安装
编译安装NDOUtils
tar -zxvf ndoutils-2.0.0
cd ndoutils-2.0.0
./configure --prefix=/usr/local/nagios --enable-mysql
make
4.拷贝文件
我的Nagios是3.5.1,所以拷贝的是ndomod-3x.o、ndo2db-3x,如果你的是2.X.x请拷贝ndomod-2x.o、ndo2db-2x
cd ndoutils-2.0.0
cd src
cp ndo2db-3x ndomod-3x.o file2sock log2ndo /usr/local/nagios/bin
cd config
cp ndo2db.cfg-sample ndomod.cfg-sample /usr/local/nagios/etc/
mv ndo2db.cfg-sample ndo2db.cfg
mv ndomod.cfg-sample ndomod.cfg
5.为NDOUtils创建数据库用户和密码
create database ndodb;
grant all on ndodb.* to 'ndouser'@'localhost' identified by 'ndouser';
grant all on ndodb.* to 'ndouser'@'%' identified by 'ndouser';
上面两条命令用来生成ndoutils所需要的数据库表等,这些表默认以“nagios_”为前缀;install脚本命 令必须在db子目录内执行:# cd db# ./installdb -u ndouser -p 123456 -h localhost -d ndodb其中各选项的意义如下:-u用来指定导入时所用的mysql用户帐号-p表示前面mysql用户的密码-h表示mysql服务器地址,假如是 localhost,则能够省略-d表示目标数据库
以下关键的一句就是创建数据库的表信息,-u为访问数据库的用户名
[root@BestTone-zabbix ndoutils-1.5.2]# cd db/
[root@BestTone-zabbix db]# ./installdb -u ndouser -p ndouser -h localhost -d ndodb#该命令保证要执行成功,不然等会会报连不上数据库错误
6.配置ndo2db.cfg文件
vim /usr/local/nagios/etc/ndo2db.cfg
lock_file=/usr/local/nagios/var/ndo2db.lock
ndo2db_user=nagios
ndo2db_group=nagios
socket_type=tcp
socket_name=/usr/local/nagios/var/ndo.sock
tcp_port=5668
use_ssl=0
db_servertype=mysql
db_host=localhost
db_port=3306
db_name=ndodb#数据库名称
db_prefix=nagios_
db_user=ndouser#数据库使用者
db_pass=ndouser#数据库密码
max_timedevents_age=1440
max_systemcommands_age=10080
max_servicechecks_age=10080
max_hostchecks_age=10080
max_eventhandlers_age=44640
max_externalcommands_age=44640
debug_level=0
debug_verbosity=1
debug_file=/usr/local/nagios/var/ndo2db.debug
max_debug_file_size=1000000
7.配置ndomod.cfg文件
vim /usr/local/nagios/etc/ndomod.cfg
instance_name=default
output_type=tcpsocket
output=127.0.0.1
tcp_port=5668
use_ssl=0
output_buffer_items=5000
buffer_file=/usr/local/nagios/var/ndomod.tmp
file_rotation_interval=14400
file_rotation_timeout=60
reconnect_interval=15
reconnect_warning_interval=15
data_processing_options=-1
config_output_options=2
8.配置nagios.cfg文件
vi /usr/local/nagios/etc/nagios.cfg
# 修改下面参数的值为-1(一般默认如此)。
event_broker_options=-1
# 复制下面内容粘贴到#broker_module=...下面。
# 注意broker_module= 和config_file是在一行上
# Uncomment the line below if you're running Nagios 3.x
broker_module=/usr/local/nagios/bin/ndomod-3x.o config_file=/usr/local/nagios/etc/ndomod.cfg
9.配置启动脚本
cd /usr/local/src/ndoutils-1.5.2
cp daemon-init /etc/init.d/ndo2db
chmod +x ndo2db
10.启动ndo2db服务
Service ndo2db start
11.重启nagios
/usr/local/nagios/bin/nagios -v /usr/local/nagios/etc/nagios.cfg
service nagios restart
12.查看启动日志信息
[root@BestTone-zabbix var]# tail -f nagios.log
[1468292167] Successfully shutdown... (PID=29500)
[1468292167] ndomod: Shutdown complete.
[1468292167] Event broker module '/usr/local/nagios/bin/ndomod-3x.o' deinitialized successfully.
[1468292167] Nagios 3.5.1 starting... (PID=14197)
[1468292167] Local time is Tue Jul 12 10:56:07 CST 2016
[1468292167] LOG VERSION: 2.0
[1468292167] ndomod: NDOMOD 1.5.2 (06-08-2012) Copyright (c) 2009 Nagios Core Development Team and Community Contributors
[1468292167] ndomod: Could not open data sink! I'll keep trying, but some output may get lost...
[1468292167] Event broker module '/usr/local/nagios/bin/ndomod-3x.o' initialized successfully.
[1468292167] Finished daemonizing... (New PID=14198)
[1468293079] ndomod: Still unable to connect to data sink. 721 items lost, 5000 queued items to flush.
13.报错ndomod: Could not open data sink! I'll keep trying, but some output may get lost...
14.处理
Vim /usr/local/nagios/etc/ndo2db.cfg
ndo2db_group=apache#修改数据库的属组为apache
cd /usr/local/nagios/bin
chown nagios:apache ndo*
cd ../etc
chown nagios:apache ndo*
15.重启相关服务
service ndo2db restart
service nagios restart
16.再次查看日志,启动成功。
[root@BestTone-zabbix var]# tail -f /usr/local/nagios/var/nagios.log
[1468293248] ndomod: Shutdown complete.
[1468293248] Event broker module '/usr/local/nagios/bin/ndomod-3x.o' deinitialized successfully.
[1468293248] Nagios 3.5.1 starting... (PID=14801)
[1468293248] Local time is Tue Jul 12 11:14:08 CST 2016
[1468293248] LOG VERSION: 2.0
[1468293248] ndomod: NDOMOD 1.5.2 (06-08-2012) Copyright (c) 2009 Nagios Core Development Team and Community Contributors
[1468293248] ndomod: Successfully connected to data sink. 5000 queued items to flush.
[1468293248] ndomod: Successfully flushed 5000 queued items to data sink.
[1468293248] Event broker module '/usr/local/nagios/bin/ndomod-3x.o' initialized successfully.
[1468293248] Finished daemonizing... (New PID=14806)
Nagios是一款开源的电脑系统和网络监视工具,能有效监控Windows、Linux和Unix的主机状态,交换机路由器等网络设置,打印机等。在系统或服务状态异常时发出邮件或短信报警第一时间通知网站运维人员,在状态恢复后发出正常的邮件或短信通知。Nagios主要功能 网络服务监控(SMTP、POP3、HTTP、NNTP、ICMP、SNMP、FTP、SSH) 主机资源监控(CPU load、disk usage、system logs),也包括Windows主机(使用NSClient++ plugin 可以指定自己编写的Plugin通过网络收集数据来监控任何情况(温度、警告……)可以通过配置Nagios远程执行插件远程执行脚本远程监控支持SSH或SSL加通道方式进行监控简单的plugin设计允许用户很容易的开发自己需要的检查服务,支持很多开发语言(shell scripts、C++、Perl、ruby、Python、PHP、C#等)包含很多图形化数据Plugins(Nagiosgraph、Nagiosgrapher、PNP4Nagios等)可并行服务检查能够定义网络主机的层次,允许逐级检查,就是从父主机开始向下检查当服务或主机出现问题时发出通告,可通过email, pager, sms 或任意用户自定义的plugin进行通知能够自定义事件处理机制重新激活出问题的服务或主机自动日志循环支持冗余监控包括Web界面可以查看当前网络状态,通知,问题历史,日志文件Nagios工作原理Nagios的功能是监控服务和主机,但是他自身并不包括这部分功能,所有的监控、检测功能都是通过各种插件来完成的。启动Nagios后,它会周期性的自动调用插件去检测服务器状态,同时Nagios会维持一个队列,所有插件返回来的状态信息都进入队列,Nagios每次都从队首开始读取信息,并进行处理后,把状态结果通过web显示出来。Nagios提供了许多插件,利用这些插件可以方便的监控很多服务状态。安装完成后,在nagios主目录下的/libexec里放有nagios自带的可以使用的所有插件,如,check_disk是检查磁盘空间的插件,check_load是检查CPU负载的,等等。每一个插件可以通过运行./check_xxx –h 来查看其使用方法和功能。Nagios可以识别4种状态返回信息,即 0(OK)表示状态正常/绿色、1(WARNING)表示出现警告/黄色、2(CRITICAL)表示出现非常严重的错误/红色、3(UNKNOWN)表示未知错误/深黄色。Nagios根据插件返回来的值,来判断监控对象的状态,并通过web显示出来,以供管理员及时发现故障。四种监控状态
再说报警功能,如果监控系统发现问题不能报警那就没有意义了,所以报警也是nagios很重要的功能之一。但是,同样的,Nagios 自身也没有报警部分的代码,甚至没有插件,而是交给用户或者其他相关开源项目组去完成的。Nagios 安装,是指基本平台,也就是Nagios软件包的安装。它是监控体系的框架,也是所有监控的基础。打开Nagios官方的文档,会发现Nagios基本上没有什么依赖包,只要求系统是Linux或者其他Nagios支持的系统。不过如果你没有安装apache(http服务),那么你就没有那么直观的界面来查看监控信息了,所以apache姑且算是一个前提条件。关于apache的安装,网上有很多,照着安装就是了。安装之后要检查一下是否可以正常工作。知道Nagios 是如何通过插件来管理服务器对象后,现在开始研究它是如何管理远端服务器对象的。Nagios 系统提供了一个插件NRPE。Nagios 通过周期性的运行它来获得远端服务器的各种状态信息。它们之间的关系如下图所示:
Nagios 通过NRPE 来远端管理服务1). Nagios 执行安装在它里面的check_nrpe 插件,并告诉check_nrpe 去检测哪些服务。2). 通过SSL,check_nrpe 连接远端机子上的NRPE daemon3). NRPE 运行本地的各种插件去检测本地的服务和状态(check_disk,..etc)4).最后,NRPE 把检测的结果传给主机端的check_nrpe,check_nrpe 再把结果送到Nagios状态队列中。5). Nagios 依次读取队列中的信息,再把结果显示出来。一: 安装配置nagiosnagios服务器端所需安装的软件:
1.首先安装下面的包:
yum install libjpeg-devel libpng-devel pango* libart_lgpl-devel pango-devel* cairo-devel* libxml2-devel php-gd gd-devel perl-GD libtoul-ltdl-devel rrdtool-perl perl-devel perl-ExtUtils-Embed perl-Time-HiRes
2.接着我们再安装下面的包
yum install httpd gd gd-devel php php-mysql mysql-devel mysql mysql-server gcc glibc glibc-common
注:原机器有的包,可以通过rpm -qa|grep 包名 检查下,如有上述包的可以不装。
3.添加nagios运行所需的用户和组
groupadd nagcmd
useradd -G nagcmd nagios
passwd nagios
4.把apache也添加到nagcmd的组里
usermod-a -G nagcmd apache
5.编译安装nagios
tar -zxvf nagios-3.5.1.tar.gz
./configure
--with-command-group=nagcmd --enable-event-broker
*** Configuration summary for nagios 3.5.1 08-30-2013 ***:
General Options:
-------------------------
Nagios executable: nagios
Nagios user/group: nagios,nagios
Command user/group: nagios,nagcmd
Embedded Perl: no
Event Broker: yes
Install ${prefix}: /usr/local/nagios
Lock file: ${prefix}/var/nagios.lock
Check result directory: ${prefix}/var/spool/checkresults
Init directory: /etc/rc.d/init.d
Apache conf.d directory: /etc/httpd/conf.d
Mail program: /bin/mail
Host OS: linux-gnu
Web Interface Options:
------------------------
HTML URL: http://localhost/nagios/ CGI URL: http://localhost/nagios/cgi-bin/ Traceroute (used by WAP): /bin/traceroute
Review the options above for accuracy. If they look okay,
type 'make all' to compile the main program and CGIs.
make all#编译所有
*** Compile finished ***
If the main program and CGIs compiled without any errors, you
can continue with installing Nagios as follows (type 'make'
without any arguments for a list of all possible options):
make install
- This installs the main program, CGIs, and HTML files
make install-init
- This installs the init script in /etc/rc.d/init.d
make install-commandmode
- This installs and configures permissions on the
directory for holding the external command file
make install-config
- This installs *SAMPLE* config files in /usr/local/nagios/etc
You'll have to modify these sample files before you can
use Nagios. Read the HTML documentation for more info
on doing this. Pay particular attention to the docs on
object configuration files, as they determine what/how
things get monitored!
make install-webconf
- This installs the Apache config file for the Nagios
web interface
make install-exfoliation
- This installs the Exfoliation theme for the Nagios
web interface
make install-classicui
- This installs the classic theme for the Nagios
web interface
*** Support Notes *******************************************
If you have questions about configuring or running Nagios,
please make sure that you:
- Look at the sample config files
- Read the documentation on the Nagios Library at: http://library.nagios.com before you post a question to one of the mailing lists.
Also make sure to include pertinent information that could
help others help you. This might include:
- What version of Nagios you are using
- What version of the plugins you are using
- Relevant snippets from your config files
- Relevant error messages from the Nagios log file
For more information on obtaining support for Nagios, visit: http://support.nagios.com *************************************************************
Enjoy.
make
install#安装
*** Main program, CGIs and HTML files installed ***
You can continue with installing Nagios as follows (type 'make'
without any arguments for a list of all possible options):
make install-init
- This installs the init script in /etc/rc.d/init.d
make install-commandmode
- This installs and configures permissions on the
directory for holding the external command file
make install-config
- This installs sample config files in /usr/local/nagios/etc
make[1]: Leaving directory `/usr/local/src/nagios'
make install-init#安装开机启动脚本
[root@localhost nagios]# make install-init
/usr/bin/install -c -m 755 -d -o root -g root /etc/rc.d/init.d
/usr/bin/install -c -m 755 -o root -g root daemon-init /etc/rc.d/init.d/nagios
*** Init script installed ***
make
install-commandmode#安装命令模式
[root@localhost nagios]# make install-commandmode
/usr/bin/install -c -m 775 -o nagios -g nagcmd -d /usr/local/nagios/var/rw
chmod g+s /usr/local/nagios/var/rw
*** External command directory configured ***
make
install-config#安装生成配置文件
*** Config files installed ***
Remember, these are *SAMPLE* config files. You'll need to read
the documentation for more information on how to actually define
services, hosts, etc. to fit your particular needs.
make
install-webconf#创建与apache关联
[root@localhost nagios]# make install-webconf
/usr/bin/install -c -m 644 sample-config/httpd.conf /etc/httpd/conf.d/nagios.conf
*** Nagios/Apache conf file installed ***
make
install-exfoliation#服务器接口主题
[root@localhost nagios]# make install-exfoliation
cp -rf contrib/exfoliation/stylesheets/* /usr/local/nagios/share/stylesheets
cp -rf contrib/exfoliation/images/* /usr/local/nagios/share/images
6.关闭 selinux
6.1编辑配置文件#永久生效,重启机器后也有效,需要重启机器
vim /etc/sysconfig/selinux
# This file controls the state of SELinux on the system.
# SELINUX= can take one of these three values:
# enforcing - SELinux security policy is enforced.
# permissive - SELinux prints warnings instead of enforcing.
# disabled - No SELinux policy is loaded.
SELINUX=disabled#把这行的改成disabled
# SELINUXTYPE= can take one of these two values:
# targeted - Targeted processes are protected,
# mls - Multi Level Security protection.
SELINUXTYPE=targeted
6.2写进内核,立即生效,重启机器后会失效
setenforce 0
7.创建密码认证文件
htpasswd -c /usr/local/nagios/etc/htpasswd.users nagiosadmin#创建用于web的登录的文件
注:该命令的执行要到安装的nagios的目录下,这里是/usr/local/nagios
[root@localhost nagios]# htpasswd -c /usr/local/nagios/etc/htpasswd.users nagiosadmin
New password:
Re-type new password:
Adding password for user nagiosadmin
8. 启动服务
service httpd start
9.把nagios加入服务
chkconfig --add nagios#加为服务
chkconfig nagios on#设为开机启动
10.安装nagios-plugins
tar -zxvf nagios-plugins-1.4.15.tar.gz#解压文件
./configure --with-nagios-user=nagios --with-nagios-group=nagios #配置nagios插件
--with-apt-get-command:
--with-ping6-command: /bin/ping6 -n -U -w %d -c %d %s
--with-ping-command: /bin/ping -n -U -w %d -c %d %s
--with-ipv6: yes
--with-mysql: /usr/bin/mysql_config
--with-openssl: yes
--with-gnutls: no
--enable-extra-opts: no
--with-perl: /usr/bin/perl
--enable-perl-modules: no
--with-cgiurl: /nagios/cgi-bin
--with-trusted-path: /bin:/sbin:/usr/bin:/usr/sbin
--enable-libtap: no
make&&make install#编译安装
/usr/bin/install -c -o nagios -g nagios 'check_breeze' '/usr/local/nagios/libexec/check_breeze'
/usr/bin/install -c -o nagios -g nagios 'check_disk_smb' '/usr/local/nagios/libexec/check_disk_smb'
/usr/bin/install -c -o nagios -g nagios 'check_flexlm' '/usr/local/nagios/libexec/check_flexlm'
/usr/bin/install -c -o nagios -g nagios 'check_ircd' '/usr/local/nagios/libexec/check_ircd'
/usr/bin/install -c -o nagios -g nagios 'check_log' '/usr/local/nagios/libexec/check_log'
/usr/bin/install -c -o nagios -g nagios 'check_oracle' '/usr/local/nagios/libexec/check_oracle'
/usr/bin/install -c -o nagios -g nagios 'check_rpc' '/usr/local/nagios/libexec/check_rpc'
/usr/bin/install -c -o nagios -g nagios 'check_sensors' '/usr/local/nagios/libexec/check_sensors'
/usr/bin/install -c -o nagios -g nagios 'check_wave' '/usr/local/nagios/libexec/check_wave'
/usr/bin/install -c -o nagios -g nagios 'check_ifstatus' '/usr/local/nagios/libexec/check_ifstatus'
/usr/bin/install -c -o nagios -g nagios 'check_ifoperstatus' '/usr/local/nagios/libexec/check_ifoperstatus'
/usr/bin/install -c -o nagios -g nagios 'check_mailq' '/usr/local/nagios/libexec/check_mailq'
/usr/bin/install -c -o nagios -g nagios 'check_file_age' '/usr/local/nagios/libexec/check_file_age'
/usr/bin/install -c -o nagios -g nagios 'utils.sh' '/usr/local/nagios/libexec/utils.sh'
/usr/bin/install -c -o nagios -g nagios 'utils.pm' '/usr/local/nagios/libexec/utils.pm'
装完/usr/local/nagios/libexec目录下应该有下面的一些插件
[root@localhost libexec]# ls
check_apt check_disk_smb check_ide_smart check_mailq check_nt check_pop check_ssh check_wave
check_breeze check_dns check_ifoperstatus check_mrtg check_ntp check_procs check_ssmtp negate
check_by_ssh check_dummy check_ifstatus check_mrtgtraf check_ntp_peer check_real check_swap urlize
check_clamd check_file_age check_imap check_mysql check_ntp_time check_rpc check_tcp utils.pm
check_cluster check_flexlm check_ircd check_mysql_query check_nwstat check_sensors check_time utils.sh
check_dhcp check_ftp check_jabber check_nagios check_oracle check_simap check_udp
check_dig check_http check_load check_nntp check_overcr check_smtp check_ups
check_disk check_icmp check_log check_nntps check_ping check_spop check_users
11.登录nagios界面
注:要关闭主机防火墙,或者在防火墙中开放主机web的访问端口。
在浏览器中输入http://服务器IP/nagios,输入nagiosadmin,和刚才设置的密码。
安装成功。
12.安装nrpe#nagios监控远程的linux机器一般用nrpe,所以我们这边装nrpe这个插件,要说的一点是nagios服务器只需安装nrpe 插件,不需要启用nrpe demon也就是守护进程。并且nrpe不需要启动服务的。
tar -zxvf nrpe-2.15.tar.gz
./configure --with-nrpe-user=nagios \
> --with-nrpe-group=nagios \
> --with-nagios-user=nagios \
> --with-nagios-group=nagios \
> --enable-command-args \#该命令必须加,需要使用nrpe后面加参数
> --enable-ssl
*** Configuration summary for nrpe 2.15 09-06-2013 ***:
General Options:
-------------------------
NRPE port: 5666
NRPE user: nagios
NRPE group: nagios
Nagios user: nagios
Nagios group: nagios
Review the options above for accuracy. If they look okay,
type 'make all' to compile the NRPE daemon and client.
make all *** Compile finished ***
If the NRPE daemon and client compiled without any errors, you
can continue with the installation or upgrade process.
Read the PDF documentation (NRPE.pdf) for information on the next
steps you should take to complete the installation or upgrade.
make
install-plugin
[root@localhost nrpe-2.15]# make install-plugin
cd ./src/ && make install-plugin
make[1]: Entering directory `/usr/local/src/nrpe-2.15/src'
/usr/bin/install -c -m 775 -o nagios -g nagios -d /usr/local/nagios/libexec
/usr/bin/install -c -m 775 -o nagios -g nagios check_nrpe /usr/local/nagios/libexec
make[1]: Leaving directory `/usr/local/src/nrpe-2.15/src'
nagios客户端所需安装的软件(被监控机器上):
1.使用yum安装所需的开发工具和开发库等包
yum -y groupinstall "Development Tools" "Development Libraries"
2.添加nagios用户
useradd -s /sbin/nologin nagios
3.安装配置nagios-plugins
./configure --with-nagios-user=nagios --with-nagios-group=nagios
make all
make install
4.安装配置nrpe
./configure --with-nrpe-user=nagios \
--with-nrpe-group=nagios \
--with-nagios-user=nagios \
--with-nagios-group=nagios \
--enable-command-args \
--enable-ssl
make all#编译所有
make install-plugin#安装nrpe主程序
make install-daemon#安装nrpe的守护进程
make install-daemon-config#安装nrpe配置文件
cd /usr/local/nagios/etc
编辑nrpe.cfg文件,把nagios服务器的IP地址加入允许的主机中,并把要监控的服务等参数添加到nrpe.cfg中。
allowed_hosts=127.0.0.1,172.30.20.51#允许的nagios服务器地址
dont_blame_nrpe=1#允许命令后接一些参数
command[check_users]=/usr/local/nagios/libexec/check_users -w 5 -c 10#监控的服务示例
5.启动nrpe
/usr/local/nagios/bin/nrpe -c /usr/local/nagios/etc/nrpe.cfg -d#启动nrpe服务
注意:客户端的主机防火墙必须关闭或者放开对5666端口的访问的限制。
在nagios服务器的libexec的插件目录中,检测nagios客户机。
[root@localhost libexec]# ./check_nrpe -H 192.168.1.10
NRPE v2.15#测试成功
二: 安装配置pnp4nagios
Pnp4nagios使用的是RRDtool工具来实现画图的,使监控界面显得更丰富多彩。
pnp4nagios原理图(Bulk Mode with NPCD)
1).执行插件
2).把Perfdata里的数据存储到Spool文件里
3).把SpoolFile文件挪到Spool目录里
4).扫描Spool目录
5).执行Perfdata命令
6).更行rrd数据库
7).写入xml数据
8).生成php网页文件
pnp4nagios是一个基于php和perl,用rrdtool将nagios采集的数据绘制图表的工具,
1.这里我们先安装rrdtool,由于系统已用yum安装rrdtool,这里已经使用yum,安装了rrdtool
[root@BestTone-zabbix ssi]# rpm -qa|grep rrdtool
rrdtool-1.3.8-7.el6.x86_64
[root@BestTone-zabbix ssi]# ll /usr/bin/rrdtool
-rwxr-xr-x. 1 root root 35192 4月 3 2014 /usr/bin/rrdtool
2.安装pnpnagios
tar -zxvf pnp4nagios-0.6.25.tar.gz
./configure --with-nagios-user=nagios
--with-nagios-group=nagios --with-rrdtool=/usr/bin/rrdtool#指定rrdtool的路径
*** Configuration summary for pnp4nagios-0.6.25 03-01-2015 ***
General Options:
------------------------- -------------------
Nagios user/group: nagios nagios
Install directory: /usr/local/pnp4nagios
HTML Dir: /usr/local/pnp4nagios/share
Config Dir: /usr/local/pnp4nagios/etc
Location of rrdtool binary: /usr/local/rrdtool/bin/rrdtool Version 1.4.8
RRDs Perl Modules: FOUND (Version 1.3008)
RRD Files stored in: /usr/local/pnp4nagios/var/perfdata
process_perfdata.pl Logfile: /usr/local/pnp4nagios/var/perfdata.log
Perfdata files (NPCD) stored in: /usr/local/pnp4nagios/var/spool
Web Interface Options:
------------------------- -------------------
HTML URL: http://localhost/pnp4nagios Apache Config File: /etc/httpd/conf.d/pnp4nagios.conf
Review the options above for accuracy. If they look okay,
type 'make all' to compile.
make all
*** Compile finished ***
make install
- This installs the main program and HTML files
make fullinstall
- This installs the main program, runlevel scripts, config and HTML files
Enjoy.
make
install#普通安装
*** Main program, Scripts and HTML files installed ***
Please run 'make install-webconf' to install the
web configuration file
Please run 'make install-config' to install sample
configuration files
Please run 'make install-init' if you want to use
BULK Mode with NPCD
make
install-webconf#安装web接口配置文件,关联apache
*** Apache config file installed ***
Restart your apache webserver to activete your changes.
Please run 'make install-config' to install sample
configuration files
Please run 'make install-init' if you want to use
BULK Mode with NPCD
make
install-config#安装pnp4nagios配置文件
*** PNP4Nagios sample config files installed ***
Please run 'make install-init' if you want to use
BULK Mode with NPCD
make
install-init#安装启动脚本,可以直接使用npcd的方式启动
[root@localhost pnp4nagios-0.6.25]# make install-init
cd ./scripts && make install-init
make[1]: Entering directory `/usr/local/src/pnp4nagios-0.6.25/scripts'
/usr/bin/install -c -m 755 -o root -g root -d /etc/rc.d/init.d
/usr/bin/install -c -m 755 -o root -g root rc.npcd /etc/rc.d/init.d/npcd
/usr/bin/install -c -m 755 -o root -g root rc.pnp_gearman_worker /etc/rc.d/init.d/pnp_gearman_worker
make[1]: Leaving directory `/usr/local/src/pnp4nagios-0.6.25/scripts'
注意:也可以在上面的配置完的选项中直接make fullinstall
3. 进入到pnp4nagios的目录/usr/local/pnp4nagios/etc中,把相关后缀带sample文件变更成无sample后缀
例如:mv web_traffic.cfg-sample web_traffic.cfg
4.配置Nagios来启用PNP4nagios
pnp4nagios有五种工作模式,常用的有三种
5.如下图所示:
5.1.Synchronous Mode
nagios.cfg 文件里改
process_performance_data=1
enable_environment_macros=1
service_perfdata_command=process-service-perfdata
host_perfdata_command=process-host-perfdata
command.cfg文件里改
define command {
command_name process-service-perfdata
command_line /usr/bin/perl /usr/local/pnp4nagios/libexec/process_perfdata.pl
}
define command {
command_name process-host-perfdata
command_line /usr/bin/perl /usr/local/pnp4nagios/libexec/process_perfdata.pl -d HOSTPERFDATA
}
注:template.cfg和定义的host.cfg里要把添加的主机模板和服务模板都加进去。这里我先介绍下几种模式。具体的模板和主机的改法我会在下面介绍。
5.2.Bulk Mode
nagios.cfg里改
注意:下面的改法,可以在原本注释的文件里去掉注释,也可以直接复制过来加在文件的最后面。
process_performance_data=1
#
# service performance data
#
service_perfdata_file=/usr/local/pnp4nagios/var/service-perfdata
service_perfdata_file_template=DATATYPE::SERVICEPERFDATA\tTIMET::$TIMET$\tHOSTNAME::$HOSTNAME$\tSERVICEDESC::$SERVICEDESC$\tSERVICEPERFDATA::$SERVICEPERFDATA$\tSERVICECHECKCOMMAND::$SERVICECHECKCOMMAND$\tHOSTSTATE::$HOSTSTATE$\tHOSTSTATETYPE::$HOSTSTATETYPE$\tSERVICESTATE::$SERVICESTATE$\tSERVICESTATETYPE::$SERVICESTATETYPE$
service_perfdata_file_mode=a
service_perfdata_file_processing_interval=15
service_perfdata_file_processing_command=process-service-perfdata-file
#
# host performance data starting with Nagios 3.0
#
host_perfdata_file=/usr/local/pnp4nagios/var/host-perfdata
host_perfdata_file_template=DATATYPE::HOSTPERFDATA\tTIMET::$TIMET$\tHOSTNAME::$HOSTNAME$\tHOSTPERFDATA::$HOSTPERFDATA$\tHOSTCHECKCOMMAND::$HOSTCHECKCOMMAND$\tHOSTSTATE::$HOSTSTATE$\tHOSTSTATETYPE::$HOSTSTATETYPE$
host_perfdata_file_mode=a
host_perfdata_file_processing_interval=15
host_perfdata_file_processing_command=process-host-perfdata-file
commands.cfg里改
define command{
command_name process-service-perfdata-file
command_line /usr/local/pnp4nagios/libexec/process_perfdata.pl --bulk=/usr/local/pnp4nagios/var/service-perfdata
}
define command{
command_name process-host-perfdata-file
command_line /usr/local/pnp4nagios/libexec/process_perfdata.pl --bulk=/usr/local/pnp4nagios/var/host-perfdata
}
5.3.Bulk Mode with NPCD
process_performance_data=1
#
# service performance data
#
service_perfdata_file=/usr/local/pnp4nagios/var/service-perfdata
service_perfdata_file_template=DATATYPE::SERVICEPERFDATA\tTIMET::$TIMET$\tHOSTNAME::$HOSTNAME$\tSERVICEDESC::$SERVICEDESC$\tSERVICEPERFDATA::$SERVICEPERFDATA$\tSERVICECHECKCOMMAND::$SERVICECHECKCOMMAND$\tHOSTSTATE::$HOSTSTATE$\tHOSTSTATETYPE::$HOSTSTATETYPE$\tSERVICESTATE::$SERVICESTATE$\tSERVICESTATETYPE::$SERVICESTATETYPE$
service_perfdata_file_mode=a
service_perfdata_file_processing_interval=15
service_perfdata_file_processing_command=process-service-perfdata-file
#
# host performance data starting with Nagios 3.0
#
host_perfdata_file=/usr/local/pnp4nagios/var/host-perfdata
host_perfdata_file_template=DATATYPE::HOSTPERFDATA\tTIMET::$TIMET$\tHOSTNAME::$HOSTNAME$\tHOSTPERFDATA::$HOSTPERFDATA$\tHOSTCHECKCOMMAND::$HOSTCHECKCOMMAND$\tHOSTSTATE::$HOSTSTATE$\tHOSTSTATETYPE::$HOSTSTATETYPE$
host_perfdata_file_mode=a
host_perfdata_file_processing_interval=15
host_perfdata_file_processing_command=process-host-perfdata-file
command.cfg更改
define command{
command_name process-service-perfdata-file
command_line /bin/mv /usr/local/pnp4nagios/var/service-perfdata /usr/local/pnp4nagios/var/spool/service-perfdata.$TIMET$
}
define command{
command_name process-host-perfdata-file
command_line /bin/mv /usr/local/pnp4nagios/var/host-perfdata /usr/local/pnp4nagios/var/spool/host-perfdata.$TIMET$
}
npcd启动方式: /usr/local/pnp4nagios/bin/npcd -d -f /usr/local/pnp4nagios/etc/npcd.cfg
5.4.Bulk Mode with NPCD and npcdmod
5.5.Gearman Mode
这两种模式就先不介绍了,一般用不到。想了解的话,详见官网:https://docs.pnp4nagios.org/pnp-0.6/config
6.这里我们选用Bulk 模式。介绍主机和服务出图的需要配置的相关步骤:
1).执行插件
2).把perfdata里的数据存储到Spool文件中
3).执行Pferdata 命令
4).读取Spool文件
5).更新rrd数据库
6).写入xml数据
7).更新做展示的php文件
6.1 定义模式
在/usr/local/nagios/etc下面修改nagios.cfg文件。在nagios.cfg里启用下面的配置(其实在/usr/local/pnp4nagios/etc下的nagios.cfg的文件里已经有了对bulk等模式的定义,我们打开nagios.cfg的文件看看。注意:是在/usr/local/pnp4nagios/etc下的nagios.cfg)
#
# Bulk / NPCD mode
#
process_performance_data=1
# *** the template definition differs from the one in the original nagios.cfg
#
service_perfdata_file=/usr/local/pnp4nagios/var/service-perfdata
service_perfdata_file_template=DATATYPE::SERVICEPERFDATA\tTIMET::$TIMET$\tHOSTNAME::$HOSTNAME$\tSERVICEDESC::$SERVICEDESC$\tSERVICEPERFDATA::$SERVICEPERFDATA$\tSERVICECHECKCOMMAND::$SERVICECHECKCOMMAND$\tHOSTSTATE::$HOSTSTATE$\tHOSTSTATETYPE::$HOSTSTATETYPE$\tSERVICESTATE::$SERVICESTATE$\tSERVICESTATETYPE::$SERVICESTATETYPE$
service_perfdata_file_mode=a
service_perfdata_file_processing_interval=15
service_perfdata_file_processing_command=process-service-perfdata-file
# *** the template definition differs from the one in the original nagios.cfg
#
host_perfdata_file=/usr/local/pnp4nagios/var/host-perfdata
host_perfdata_file_template=DATATYPE::HOSTPERFDATA\tTIMET::$TIMET$\tHOSTNAME::$HOSTNAME$\tHOSTPERFDATA::$HOSTPERFDATA$\tHOSTCHECKCOMMAND::$HOSTCHECKCOMMAND$\tHO
STSTATE::$HOSTSTATE$\tHOSTSTATETYPE::$HOSTSTATETYPE$
host_perfdata_file_mode=a
host_perfdata_file_processing_interval=15
host_perfdata_file_processing_command=process-host-perfdata-file
6.2 定义命令
修改 /usr/local/nagios/etc/commands.cfg文件,命令如下
注意:这两个命令可以定义到配置文件的最下面,把本来机器上带的# 'process-host-perfdata' command definition 注释掉
#
# Bulk mode
#
define command {
command_name process-service-perfdata-file
command_line /usr/local/pnp4nagios/libexec/process_perfdata.pl --bulk /usr/local/pnp4nagios/var/service-perfdata
}
define command {
command_name process-host-perfdata-file
command_line /usr/local/pnp4nagios/libexec/process_perfdata.pl --bulk /usr/local/pnp4nagios/var/host-perfdata
}
6.3 定义模板
然后修改/usr/local/nagios/etc/templates.cfg文件,定义主机模板和服务模板,把下面所示的配置加入到templates.cfg的最下面。
define host {
name host-pnp
action_url /pnp4nagios/graph?host=$HOSTNAME$&srv=_HOST_' class='tips' rel='/pnp4nagios/popup?host=$HOSTNAME$&srv=_HOST_
register 0
}
define service {
name srv-pnp
action_url /pnp4nagios/graph?host=$HOSTNAME$&srv=$SERVICEDESC$' class='tips' rel='/pnp4nagios/popup?host=$HOSTNAME$&srv=$SERVICEDESC$
register 0
}
6.4 定义主机
这里以localhost主机为例,修改/usr/local/nagios/etc/localhost.cfg的配置文件
# Define a host for the local machine
define host{
use linux-server,host-pnp #加入主机模板
host_name localhost
alias localhost
address 127.0.0.1
}
# Define a service to "ping" the local machine
define service{
use local-service,srv-pnp#加入服务模板
host_name localhost
service_description PING
check_command check_ping!100.0,20%!500.0,60%
}
7.然后添加小太阳模版,镶嵌在nagios页面上.你只需要把鼠标移动到太阳图标上面就会自动弹出图形出来
cd /usr/local/src/pnp4nagios-0.6.25/contrib/ssi#进入到pnp4nagios源码目录
cp status-header.ssi /usr/local/nagios/share/ssi#拷贝status-header.ssi到/usr/local/nagios/share/ssi/目录下面来(这一步很重要,要不然移动到太阳标记上出不了图)
8.检查nagios配置并重启服务。
service npcd start
service nagios restart
service httpd restart
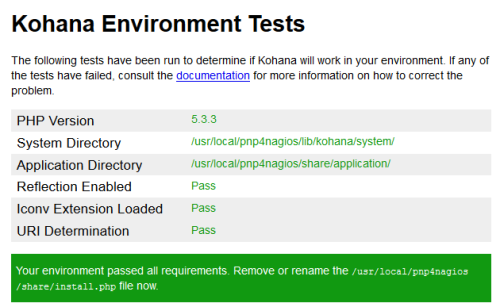
9.输入访问地址http://192.168.1.7/pnp4nagios,出现如下图所示界面
然后把/usr/local/pnp4nagios/share/install.php下面的install.php打成bak文件
过一段时间就出图了
效果如下图所示:
已经出图,证明pnp4nagios安装成功!
三: 安装配置nagiosql
NagiosQL
是专为nagios设计的web图形化管理应用,主要作用就是操作数据库和配置文件,其中包括将配置文件的信息写到数据库中,在数据库中修改Nagios
的监控配置信息,并将数据库中存放的配置更新到文件中。用户可以通过NagiosQL提供的Web页面直观的修改配置。实现架构很简单,功能很实用。
Nagiosql功能介绍:
1. 具有基本的nagios的配置管理能力,导入,导出配置文件的功能
2. 具有nagios配置文件检查、排错的能力
3. Nagiosql可对文件结构进行定制,可延续之前的配置结构,按IP生成配置
4. Nagiosql将每一次配置的变更做一次配置备份,以时间戳为后缀保存,理论上可以回滚到任意一个历史配置
NagiosQL项目地址:http://www.nagiosql.org/
1.下面我们来安装nagiosql
tar -zxvf nagiosql_311.tar.gz
mv nagiosql /usr/local/nagios/#把解压出来的文件,迁移到/usr/local/nagios/下面
2. 建立nagiosql导出nagios配置文件的目录并修改权限
mkdir -p /etc/nagiosql/{hosts,services,backup/{,hosts,services},import}chown -R apache:nagios /etc/nagiosql/chmod -R 755 /etc/nagiosqlchmod 777 /usr/local/nagios/nagiosql/config
3. Nagios相关文件权限的设定
chown nagios:apache /usr/local/nagios/etcchown nagios:apache /usr/local/nagios/etc/{nagios.cfg,cgi.cfg}chown nagios:apache /usr/local/nagios/etc/*chmod 664 /usr/local/nagios/etc/{nagios.cfg,cgi.cfg}chmod 775 /usr/local/nagios/etc
4. 设定nagios二进制文件的权限,以便其能够通过Web程序执行
chown nagios:apache /usr/local/nagios/bin/nagioschmod 750 /usr/local/nagios/bin/nagioschown -R apache.nagios /usr/local/nagios/var/spool/chown nagios:apache /usr/local/nagios/var/rw/nagios.cmdchmod 660 /usr/local/nagios/var/rw/nagios.cmd
5. 为apache添加nagiosQL虚拟目录
vim /etc/httpd/conf.d/nagios.conf 最后增加如下内容:Alias /nagiosQL "/usr/local/nagios/nagiosql" <Directory "/usr/local/nagios/nagiosql"> # SSLRequireSSL Options None AllowOverride None Order allow,deny Allow from all </Directory>
6. 建立nagiosql安装文件
touch /usr/local/nagios/nagiosql/install/ENABLE_INSTALLER
7. 重启httpd服务
service httpd restart
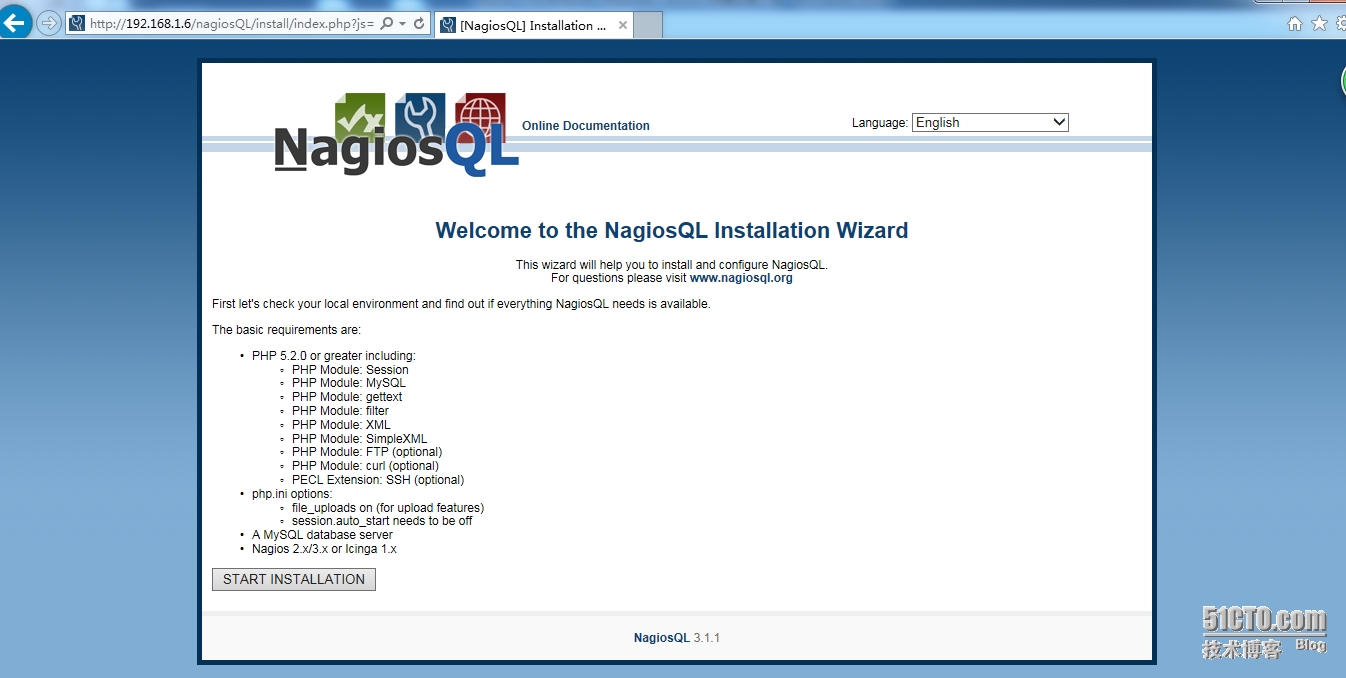
8.登录地址http://192.168.1.6/nagiosQL会看见出现下面nagiosql安装界面
注意:要启动mysql数据库,并设置mysql相应的登录帐号和权限。
进去把页面设置为中文,然后配置一些参数。
9. 登入管理界面
(1).管理域,配置对一些域的参数。
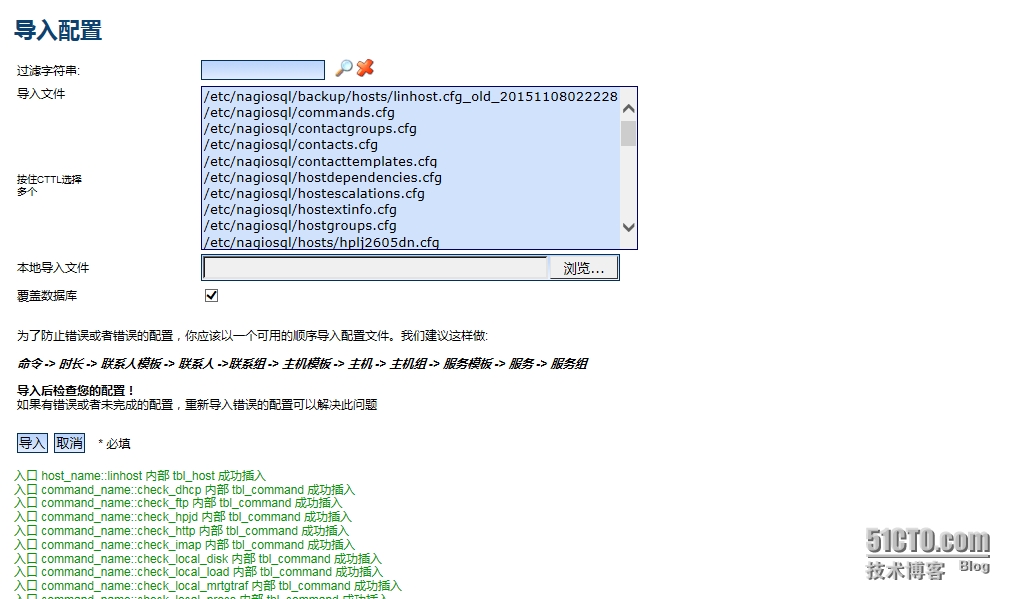
(2)工具-导入数据 右边会列出一些配置文件,选择导入即可。
导入只是把配置文件内容导入到Mysql数据库,而使用其配置文件时,是一个个cfg文件,所以下面要进行写入过程,写完并检查写入文件。
(3)检查配置并重启nagios
(4)写入之后就可以看到相应的cfg文件了,查看写入是否成功
ll /etc/nagiosql
(5) 在/usr/local/nagios/etc/nagios.cfg配置文件里,将原有以cfg_file开头项全部注释掉,加入新的配置文件路径
cfg_dir=/etc/nagiosql/hosts/
cfg_dir=/etc/nagiosql/services/
cfg_file=/etc/nagiosql/commands.cfg
cfg_file=/etc/nagiosql/contactgroups.cfg
cfg_file=/etc/nagiosql/contacts.cfg
cfg_file=/etc/nagiosql/contacttemplates.cfg
cfg_file=/etc/nagiosql/hostdependencies.cfg
cfg_file=/etc/nagiosql/hostescalations.cfg
cfg_file=/etc/nagiosql/hostextinfo.cfg
cfg_file=/etc/nagiosql/hostgroups.cfg
cfg_file=/etc/nagiosql/hosttemplates.cfg
cfg_file=/etc/nagiosql/servicedependencies.cfg
cfg_file=/etc/nagiosql/serviceescalations.cfg
cfg_file=/etc/nagiosql/serviceextinfo.cfg
cfg_file=/etc/nagiosql/servicegroups.cfg
cfg_file=/etc/nagiosql/servicetemplates.cfg
cfg_file=/etc/nagiosql/timeperiods.cfg
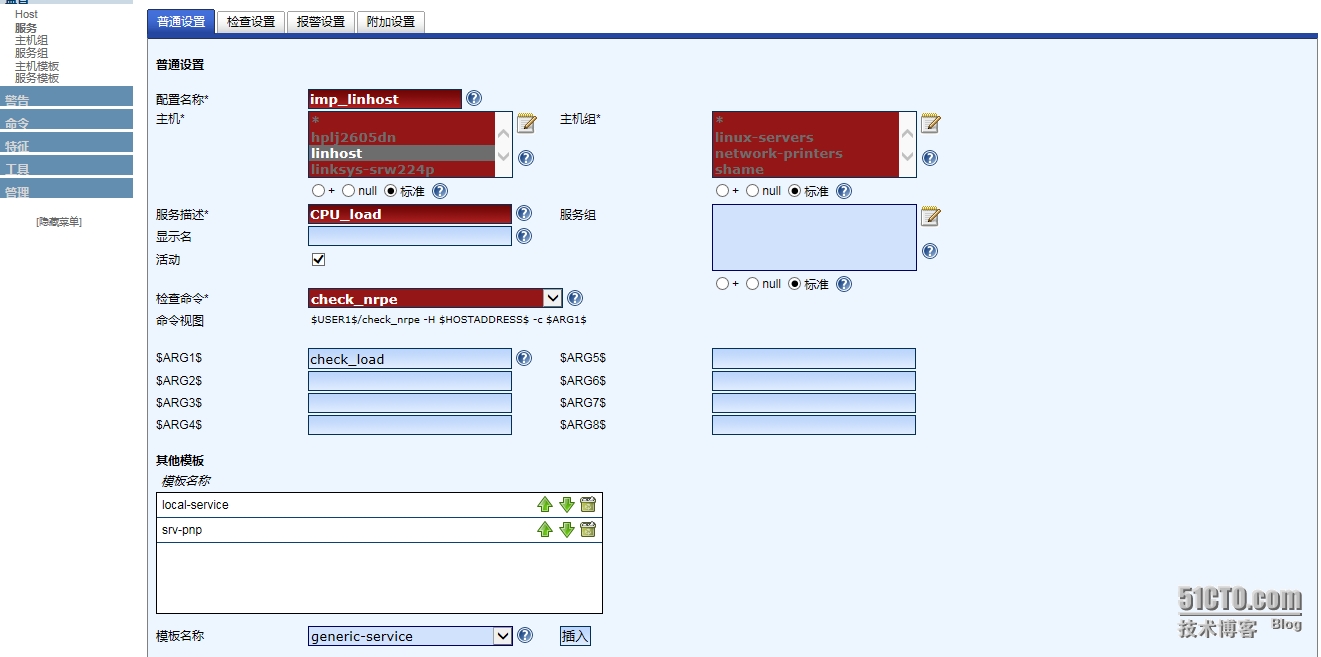
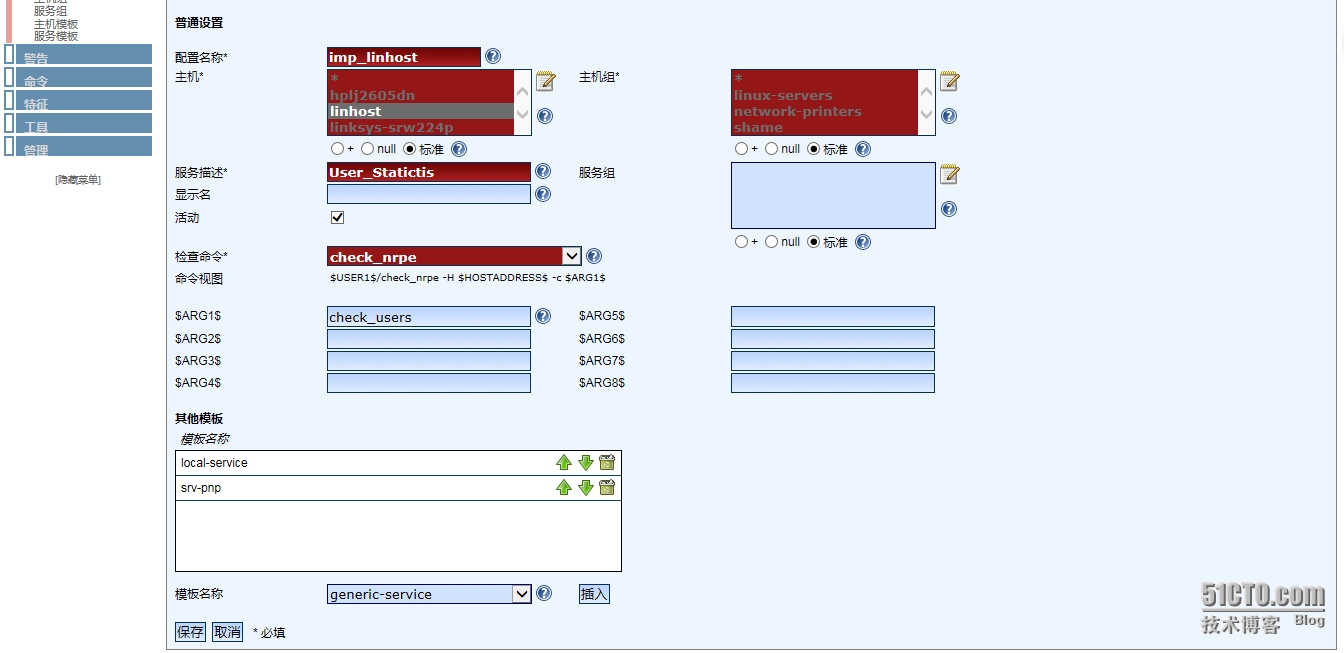
(6) 定义要监控的命令
例如:nrpe
(7) 添加要监控的主机。
(8)添加要监控的服务
注意:主机的模板要加上host-pnp,服务的模板srv-pnp都要加上。监控端命令行配置的命令,要与被监控端的nrpe.cfg配置的文件一致。
(9) 重启nagios,看看显示效果。
先要导入配置:
然后点 “工具”-"nagios控制“再执行下图所示的几个步骤:
(10) 执行完,会有下图所示的效果:
(11)添加监控mysql数据库服务
mysql> create database nagdb defaultCHARSET=utf8;
Query OK, 1 row affected(0.01 sec)
mysql> grant select on nagdb.* to 'nagios'@'%';
Query OK, 0 rows affected (0.00 sec)
mysql> update mysql.user set password =password('nagios') where user='nagios';
Query OK, 2 rows affected (0.00 sec)
Rows matched: 2 Changed: 2 Warnings: 0
mysql> flush privileges;
Query OK, 0 rows affected (0.00 sec)
mysql> quit
Bye
[root@localhost libexec]# ./check_mysql -H127.0.0.1 -u nagios -d nagdb -p nagios;
Uptime: 150 Threads: 1 Questions: 8 Slow queries: 0 Opens: 15 Flush tables: 1 Open tables:8 Queries per second avg: 0.53
然后定义监控的命令
定义要监控的主机和服务
导入定义好的数据
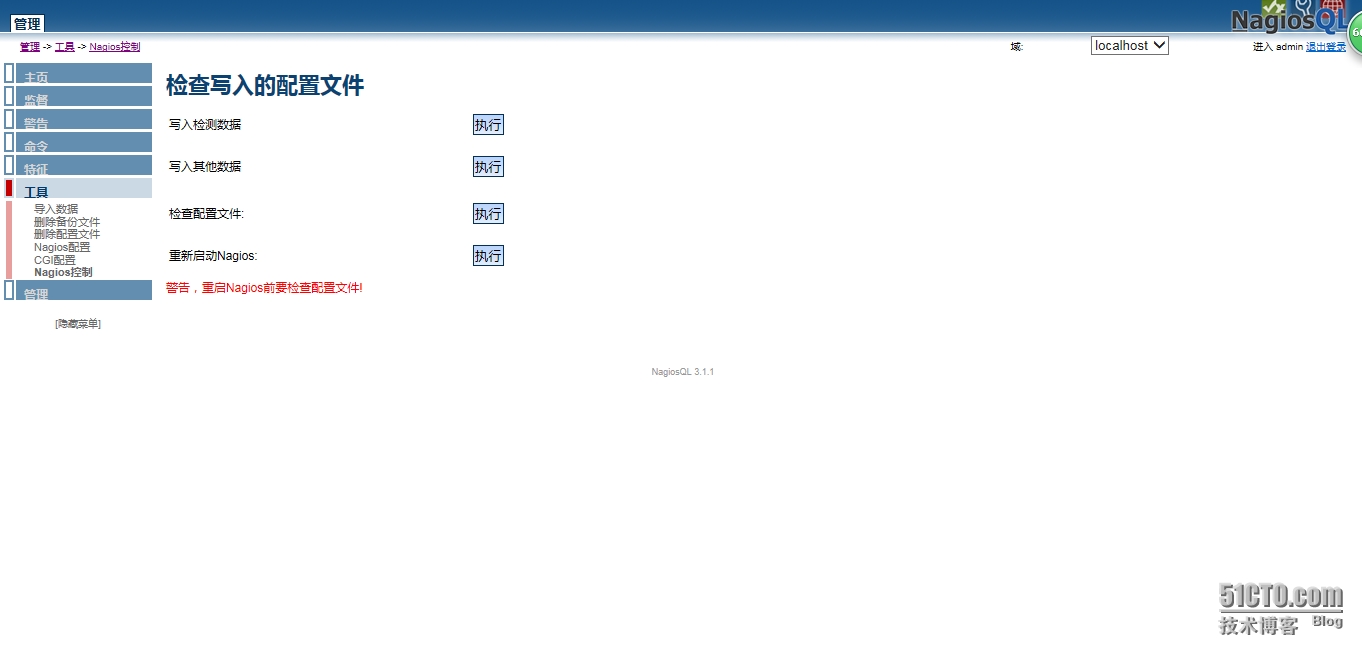
按照以下的几个步骤:写入检测数据、写入其他数据、检查配置文件、重启nagios
检测效果:
(12) 添加告警邮件设置:
先定义联系人
定义需监控的主机
定义需监控的服务
定义服务的一些参数
定义主机的一些参数
然后重启nagios服务
“工具”-》“Nagios控制”-》“检查写入的配置文件”下面的四个按钮按顺序执行一遍,如下图:
四: 安装配置ndoutils
NDOUtils简介
NDOUTILS ADDON主要用来将Nagios的配置信息和event产生的数据存入数据库
以方便实现数据的快速检索和处理,并且为其它通过web接口程序来管理这些数据提供了保障。
在一个大型应用中,可能存在多个独立的或分布式布置的Nagios服务器,这种环境中的每个Nagios服务器通常被称为一个Nagios实例。在多Nagios实例的环境中,既可以把所有实例的数据存入到一个数据库,也可以将各实例的数据分别存储。
NDO Utils主要由以下四个部分组成:
1)NDOMOD Event Broker
Module(NDOMOD.O):用来输出Nagios进程产生的数据(data和logic),其前提是Nagios在编译时开启了Event
broker的功能。同时,NDOMOD模块还可以导出Nagios配置有关的信息(包括Nagios监控进程运行时环境产生的动态数据)至文件、
Unix域套接字或者TCP套接字。NDO2DB将通过前面的这三种方式获得Nagios的有关数据。
2)NDO2DB:用来接收由NDOMOD和LOG2NDO组件输出的信息并将之存储在数据库中。启动时,NDO2DB进程将创建一个TCP套接字或Unix域套接字以监听客户端(输出端)的连接请求。目前仅支持MySQL数据库。
多个客户端可以同时向一个NDO2DB守护进程输出数据,此时的NDO2DB将为每一个连接进来的客户端(Nagios实例)建立一个连接进程,以实现每个客户端数据的独立存储、检索和处理。
3)LOG2NDO:用来将Nagios的历史日志通过NDO2DB进程输出至数据库。LOG2NDO与NDO2DB进程通信的方法依然是标准文件、Unix域套接字或者TCP套接字三种。
4)FILE2SOCK:从标准文件或标准输入读入数据,并将之输出至Unix域套接字或TCP套接字。当NDOMOD或LOG2NDO将数据输出至标准文件时,此工具则可用来将这些标准文件中数据读出并发送给NDO2DB进程监听的TCP套接字或Unix域套接字。
下面我们来安装ndoutils,安装方法,使用源码编译
1.DBI的安装
到官网http://www.cpan.org/modules/by-module/DBI/ 下载
这里下载的是DBI-1.633.tar.gz
tar -zxvf DBI-1.633.tar.gz
cd DBI-1.633
perl Makefile.PL
make
make test
这里出现test错误,不用管他,继续安装。
make install
2. DBD的安装
DBD-mysql-4.025
tar -zxvfDBD-mysql-4.025.tar.gz
cd DBD-mysql-4.025
perl Makefile.PL --libs="-L/usr/lib64/mysql #mysql使用yum装的,检查配置时系统一般能找到头文件和库文件的位置,不用过多配置一些选项
make
make test
make install
3.NDOUTILS安装
编译安装NDOUtils
tar -zxvf ndoutils-2.0.0
cd ndoutils-2.0.0
./configure --prefix=/usr/local/nagios --enable-mysql
make
4.拷贝文件
我的Nagios是3.5.1,所以拷贝的是ndomod-3x.o、ndo2db-3x,如果你的是2.X.x请拷贝ndomod-2x.o、ndo2db-2x
cd ndoutils-2.0.0
cd src
cp ndo2db-3x ndomod-3x.o file2sock log2ndo /usr/local/nagios/bin
cd config
cp ndo2db.cfg-sample ndomod.cfg-sample /usr/local/nagios/etc/
mv ndo2db.cfg-sample ndo2db.cfg
mv ndomod.cfg-sample ndomod.cfg
5.为NDOUtils创建数据库用户和密码
create database ndodb;
grant all on ndodb.* to 'ndouser'@'localhost' identified by 'ndouser';
grant all on ndodb.* to 'ndouser'@'%' identified by 'ndouser';
上面两条命令用来生成ndoutils所需要的数据库表等,这些表默认以“nagios_”为前缀;install脚本命 令必须在db子目录内执行:# cd db# ./installdb -u ndouser -p 123456 -h localhost -d ndodb其中各选项的意义如下:-u用来指定导入时所用的mysql用户帐号-p表示前面mysql用户的密码-h表示mysql服务器地址,假如是 localhost,则能够省略-d表示目标数据库
以下关键的一句就是创建数据库的表信息,-u为访问数据库的用户名
[root@BestTone-zabbix ndoutils-1.5.2]# cd db/
[root@BestTone-zabbix db]# ./installdb -u ndouser -p ndouser -h localhost -d ndodb#该命令保证要执行成功,不然等会会报连不上数据库错误
6.配置ndo2db.cfg文件
vim /usr/local/nagios/etc/ndo2db.cfg
lock_file=/usr/local/nagios/var/ndo2db.lock
ndo2db_user=nagios
ndo2db_group=nagios
socket_type=tcp
socket_name=/usr/local/nagios/var/ndo.sock
tcp_port=5668
use_ssl=0
db_servertype=mysql
db_host=localhost
db_port=3306
db_name=ndodb#数据库名称
db_prefix=nagios_
db_user=ndouser#数据库使用者
db_pass=ndouser#数据库密码
max_timedevents_age=1440
max_systemcommands_age=10080
max_servicechecks_age=10080
max_hostchecks_age=10080
max_eventhandlers_age=44640
max_externalcommands_age=44640
debug_level=0
debug_verbosity=1
debug_file=/usr/local/nagios/var/ndo2db.debug
max_debug_file_size=1000000
7.配置ndomod.cfg文件
vim /usr/local/nagios/etc/ndomod.cfg
instance_name=default
output_type=tcpsocket
output=127.0.0.1
tcp_port=5668
use_ssl=0
output_buffer_items=5000
buffer_file=/usr/local/nagios/var/ndomod.tmp
file_rotation_interval=14400
file_rotation_timeout=60
reconnect_interval=15
reconnect_warning_interval=15
data_processing_options=-1
config_output_options=2
8.配置nagios.cfg文件
vi /usr/local/nagios/etc/nagios.cfg
# 修改下面参数的值为-1(一般默认如此)。
event_broker_options=-1
# 复制下面内容粘贴到#broker_module=...下面。
# 注意broker_module= 和config_file是在一行上
# Uncomment the line below if you're running Nagios 3.x
broker_module=/usr/local/nagios/bin/ndomod-3x.o config_file=/usr/local/nagios/etc/ndomod.cfg
9.配置启动脚本
cd /usr/local/src/ndoutils-1.5.2
cp daemon-init /etc/init.d/ndo2db
chmod +x ndo2db
10.启动ndo2db服务
Service ndo2db start
11.重启nagios
/usr/local/nagios/bin/nagios -v /usr/local/nagios/etc/nagios.cfg
service nagios restart
12.查看启动日志信息
[root@BestTone-zabbix var]# tail -f nagios.log
[1468292167] Successfully shutdown... (PID=29500)
[1468292167] ndomod: Shutdown complete.
[1468292167] Event broker module '/usr/local/nagios/bin/ndomod-3x.o' deinitialized successfully.
[1468292167] Nagios 3.5.1 starting... (PID=14197)
[1468292167] Local time is Tue Jul 12 10:56:07 CST 2016
[1468292167] LOG VERSION: 2.0
[1468292167] ndomod: NDOMOD 1.5.2 (06-08-2012) Copyright (c) 2009 Nagios Core Development Team and Community Contributors
[1468292167] ndomod: Could not open data sink! I'll keep trying, but some output may get lost...
[1468292167] Event broker module '/usr/local/nagios/bin/ndomod-3x.o' initialized successfully.
[1468292167] Finished daemonizing... (New PID=14198)
[1468293079] ndomod: Still unable to connect to data sink. 721 items lost, 5000 queued items to flush.
13.报错ndomod: Could not open data sink! I'll keep trying, but some output may get lost...
14.处理
Vim /usr/local/nagios/etc/ndo2db.cfg
ndo2db_group=apache#修改数据库的属组为apache
cd /usr/local/nagios/bin
chown nagios:apache ndo*
cd ../etc
chown nagios:apache ndo*
15.重启相关服务
service ndo2db restart
service nagios restart
16.再次查看日志,启动成功。
[root@BestTone-zabbix var]# tail -f /usr/local/nagios/var/nagios.log
[1468293248] ndomod: Shutdown complete.
[1468293248] Event broker module '/usr/local/nagios/bin/ndomod-3x.o' deinitialized successfully.
[1468293248] Nagios 3.5.1 starting... (PID=14801)
[1468293248] Local time is Tue Jul 12 11:14:08 CST 2016
[1468293248] LOG VERSION: 2.0
[1468293248] ndomod: NDOMOD 1.5.2 (06-08-2012) Copyright (c) 2009 Nagios Core Development Team and Community Contributors
[1468293248] ndomod: Successfully connected to data sink. 5000 queued items to flush.
[1468293248] ndomod: Successfully flushed 5000 queued items to data sink.
[1468293248] Event broker module '/usr/local/nagios/bin/ndomod-3x.o' initialized successfully.
[1468293248] Finished daemonizing... (New PID=14806)

相关文章推荐
- 【CF 应用开发大赛】IT Share(IT分享网)
- 网络监控器Nagios全攻略
- 基于Nagios网络监控平台的实现--具体事例
- Nagios 笔记 Nagios服务端+客户端 + 短信报警 + 性能显示的图形插件
- FreeBSD下解决Nagios不发报警邮件的问题
- 收到新书两本
- 新版本susymenu树形菜单,请大家指教、分享
- javascript实现类似百度分享功能的方法
- 网页上facebook分享功能具体实现
- nagios 分发文件实现代码
- Shell脚本编写Nagios插件监控程序资源占用
- Nagios监控Windows Server 2008配置方法
- Shell脚本实现批量生成nagios配置文件
- js实现选中页面文字将其分享到新浪微博
- Android编程之微信SDK分享功能过程步骤详细分析
- Android编程实现微信分享信息的方法
- Android应用中加入微信分享简单方法
- 基于Linux下Nagios的安装与配置说明介绍[图]
- java实现的新浪微博分享代码实例
- shell脚本监控linux系统内存使用情况的方法(不使用nagios监控linux)