phpstrom+xdebug 配置
2015-11-01 16:49
771 查看
1,下载对应php对应版本xdebug并,配置php.ini
[XDebug]
xdebug.profiler_append = 0
xdebug.profiler_enable = 1
xdebug.profiler_enable_trigger = 0
xdebug.profiler_output_dir =”D:\phpStudy\tmp\xdebug”
xdebug.trace_output_dir =”D:\phpStudy\tmp\xdebug”
xdebug.profiler_output_name = “cache.out.%t-%s”
xdebug.remote_enable = 1
xdebug.remote_handler = “dbgp”
xdebug.remote_host = “127.0.0.1”
xdebug.remote_port = 9010 为了端口不冲突,可使用其他
xdebug.idekey = PHPSTORM 和浏览器插件对应
zend_extension=”D:\phpStudy\php55n\ext\xdebug.dll”
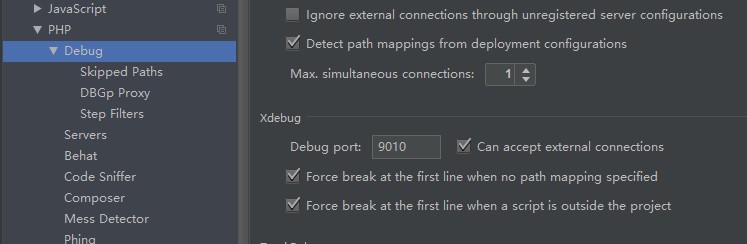
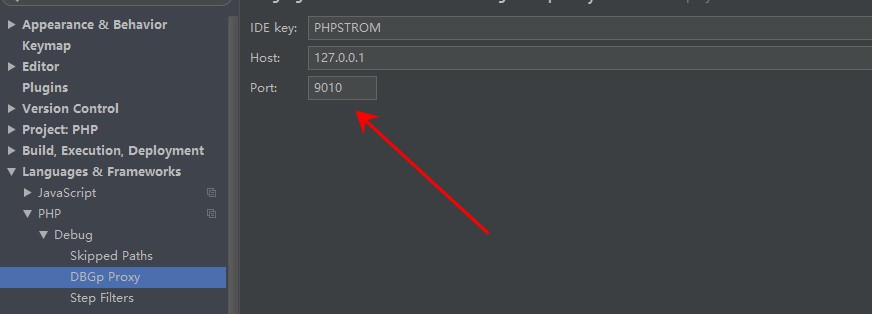
2,配置phpstrom,有两处端口
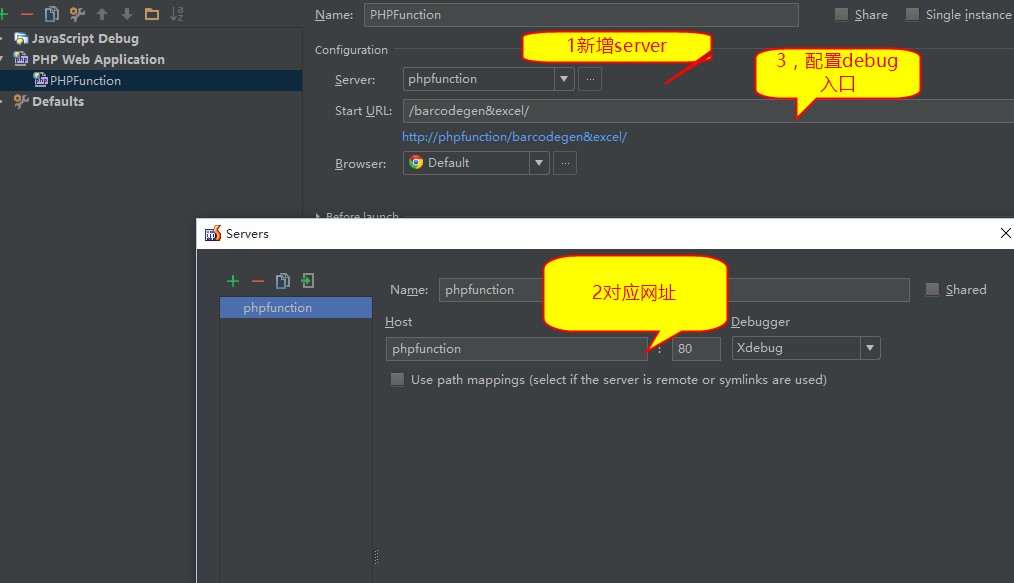
3,配置debug入口
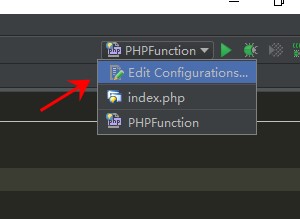
选择新增web application,再新增server
这里的phpfunction是我配置的虚拟主机(你也可以是localhost或其他www)
4,设置断点
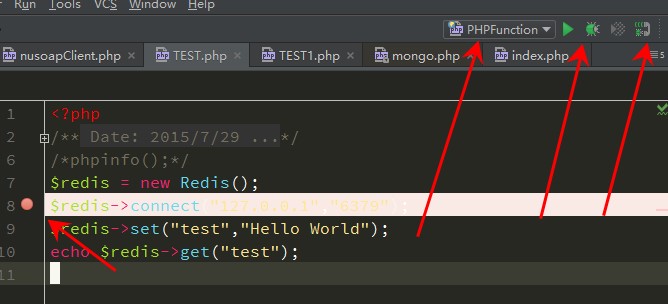
这里都要有哈,
5,开始调试
然后点击调试,会打开网页,然后你在编辑器中单步调试F8,phpstrom会有对应变化,浏览器也会有(等到有浏览器内容显示的时候)
[XDebug]
xdebug.profiler_append = 0
xdebug.profiler_enable = 1
xdebug.profiler_enable_trigger = 0
xdebug.profiler_output_dir =”D:\phpStudy\tmp\xdebug”
xdebug.trace_output_dir =”D:\phpStudy\tmp\xdebug”
xdebug.profiler_output_name = “cache.out.%t-%s”
xdebug.remote_enable = 1
xdebug.remote_handler = “dbgp”
xdebug.remote_host = “127.0.0.1”
xdebug.remote_port = 9010 为了端口不冲突,可使用其他
xdebug.idekey = PHPSTORM 和浏览器插件对应
zend_extension=”D:\phpStudy\php55n\ext\xdebug.dll”
2,配置phpstrom,有两处端口
3,配置debug入口
选择新增web application,再新增server
这里的phpfunction是我配置的虚拟主机(你也可以是localhost或其他www)
4,设置断点
这里都要有哈,
5,开始调试
然后点击调试,会打开网页,然后你在编辑器中单步调试F8,phpstrom会有对应变化,浏览器也会有(等到有浏览器内容显示的时候)

相关文章推荐
- 一个关于if else容易迷惑的问题
- PHP5.2.*防止Hash冲突拒绝服务攻击的Patch
- 深入理解PHP之匿名函数
- JSP/PHP基于Ajax的分页功能实现
- 关于PHP通过PDO用中文条件查询MySQL的问题。
- 什么是设计模式
- PHP数据库长连接mysql_pconnect的细节
- Php Installing An Expansion
- PHP+Apache在Windows 9x下的安装和配置
- IIS 6 的 PHP 最佳配置方法
- 安装Apache和PHP的一些补充
- Linux Apache+MySQL+PHP
- 建立Apache+PHP+MySQL数据库驱动的动态网站
- PHP 5.3.0 安装分析心得
- apache 环境下 php 的配置注意事项
- ASP.NET、ASP、PHP、JSP之间有什么区别?
- PHP VBS JS 函数 对照表
- C语言实现的统计php代码行数功能源码(支持文件夹、多目录)
- php xml 入门学习资料