用 Graphviz+pvtrace 可视化函数调用
2015-10-23 12:52
239 查看
最近在想怎么把一个程序的函数调用关系快速的用流程图的方式画出来,之后看到了这个一篇文章“用 Graphviz 可视化函数调用”(http://www.ibm.com/developerworks/cn/linux/l-graphvis/)感觉不错,详细的原理请看原文章,这里只把我的实验过程记录下,以备自己以后的不时之需。
[b]1、要有代码,随便写个小程序,如下所示。[/b]
#cat test.c
[b]2、要下载一个叫pvtrace的解析工具[/b],我把它放到了百度网盘上:http://pan.baidu.com/s/1sj23YPJ
这个工具解压后的文件如下
之后编译、安装
[b]3、把pvtrace目录下的instrument.c文件放到你的项目下[/b]
修改Makefile,编译test.c的时候把这个源文件加上。还有就是在编译选项中加上这个参数 -finstrument-functions
编译自己的项目:
[b]4、现在开始生成函数调用的流程图了[/b]
运行自己的项目test
注:这里有个问题是你的程序运行多少,它记录多少函数之间的关系。你运行的少,它就记录的少,运行的多久记录的多。也就是说,那些暂时没有运行的代码,是不能被记录的。这个在原文章中有说明,因为人家记录的时候就是在运行的时候记录的嘛。
运行完成后会生成一个叫做trace.txt的文件
接下来使用pvtrace解析这个文件,但是pvtrace后面跟的参数不是trace.txt,而是我们的程序test
生成了gaph.dot文件,接下来就是使用Graphviz的dot工具,把这个graph.dot变成一个图片了。
注:没有Graphviz的话可以去官网下载或者使用命令“#yum install graphviz”进行安装:
我这里有一个安装graphviz的笔记:/article/5180503.html
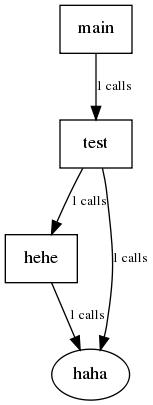
生成的流程图如下:
参考:
http://www.ibm.com/developerworks/cn/linux/l-graphvis/ http://blog.sina.com.cn/s/blog_67fcf49e0101m9r0.html http://download.csdn.net/download/u011843461/8389925
[b]1、要有代码,随便写个小程序,如下所示。[/b]
#cat test.c
#include <stdio.h>
#include <string.h>

void haha();
void hehe()
{
printf("int hehe\n");
haha();
}

void test()
{
printf("hehe test\n");
hehe();
haha();
}

void haha()
{
printf("in haha\n");
}

int main()
{
test();
printf("hello world !\n");

return 0;
}[b]2、要下载一个叫pvtrace的解析工具[/b],我把它放到了百度网盘上:http://pan.baidu.com/s/1sj23YPJ
这个工具解压后的文件如下
# unzip pvtrace.zip
[root@localhost pvtrace]# ls
instrument.c  Makefile  stack.c  stack.h  symbols.c  symbols.h  trace.c
之后编译、安装
[root@localhost pvtrace]# make
gcc  -Wall -c trace.c
gcc  -Wall -c symbols.c
gcc  -Wall -c stack.c
gcc -o pvtrace trace.o symbols.o stack.o
[root@localhost pvtrace]# make install
cp pvtrace /usr/local/bin
[b]3、把pvtrace目录下的instrument.c文件放到你的项目下[/b]
# ls
instrument.c  Makefile  test.c
修改Makefile,编译test.c的时候把这个源文件加上。还有就是在编译选项中加上这个参数 -finstrument-functions
编译自己的项目:
# make
gcc -g -c -o test.o test.c -I../../include -g -finstrument-functions
gcc -g -c -o instrument.o instrument.c -I../../include -g -finstrument-functions
gcc -g -o test test.o instrument.o -L./
[b]4、现在开始生成函数调用的流程图了[/b]
运行自己的项目test
# ./test
注:这里有个问题是你的程序运行多少,它记录多少函数之间的关系。你运行的少,它就记录的少,运行的多久记录的多。也就是说,那些暂时没有运行的代码,是不能被记录的。这个在原文章中有说明,因为人家记录的时候就是在运行的时候记录的嘛。
运行完成后会生成一个叫做trace.txt的文件
# ls
instrument.c  instrument.o  Makefile  test  test.c  test.o  trace.txt
接下来使用pvtrace解析这个文件,但是pvtrace后面跟的参数不是trace.txt,而是我们的程序test
[root@localhost drawFuncPic]# pvtrace test
[root@localhost drawFuncPic]# ls
graph.dot  instrument.c  instrument.o  Makefile  test  test.c  test.o  trace.txt
生成了gaph.dot文件,接下来就是使用Graphviz的dot工具,把这个graph.dot变成一个图片了。
[root@localhost drawFuncPic]# dot -Tjpg graph.dot -o graph.jpg
[root@localhost drawFuncPic]# ls
graph.dot  graph.jpg  instrument.c  instrument.o  Makefile  test  test.c  test.o  trace.txt
注:没有Graphviz的话可以去官网下载或者使用命令“#yum install graphviz”进行安装:
# yum install graphviz
Loaded plugins: fastestmirror, security
Loading mirror speeds from cached hostfile
* base: mirrors.btte.net
* extras: mirrors.yun-idc.com
* updates: mirrors.opencas.cn
Setting up Install Process
Package graphviz-2.26.0-10.el6.x86_64 already installed and latest version
Nothing to do
我这里有一个安装graphviz的笔记:/article/5180503.html
生成的流程图如下:
参考:
http://www.ibm.com/developerworks/cn/linux/l-graphvis/ http://blog.sina.com.cn/s/blog_67fcf49e0101m9r0.html http://download.csdn.net/download/u011843461/8389925

相关文章推荐
- LintCode-删除排序数组中的重复数字 II
- jquery.rotate插件实现转盘抽奖示例
- PHP文件下载实例
- [Leetcode]Partition List
- 大型网站核心的架构(6-1)基本要素
- Bootstrap 学习(1)
- Redis学习笔记十五、实例代码
- poj 3984 迷宫问题..
- 微信开发(一):用JSAPI做微信支付+微信卡包(代金券)
- Redis学习笔记十四、内存优化
- C++多级指针的”解引用“
- Linux---用户和用户组
- Redis学习笔记十三、服务器管理
- 值得学习的博客
- 个人网站及无备案网站将无法得到腾讯认证
- codevs1959拔河比赛[三星~]
- HDU 1557 权利指数 国家压缩 暴力
- windows server 2008 r2, 每隔一段时间自动关机
- Redis学习笔记十二、管线
- 2015年奇虎360服务器开发C++电话面试问题