How to enable logging
2015-09-28 20:52
1196 查看
转自:https://www.chromium.org/for-testers/enable-logging
How to enable logging
To enable logging, launch Chrome with these command line flags:--enable-logging --v=1 This will turn on full logging support (INFO, WARNING, ERROR, and VERBOSE0 for >=M9). Verbose logging shows up with their own VERBOSEn label. --vmoduleenables verbose logging on a per module basis. Details in base/logging.h. Most logs that used to be INFO have been moved to use verbose logging. Any page load (even the new tab page) will print messages tagged with VERBOSE1; for example: [28304:28320:265508881314:VERBOSE1:chrome/browser/renderer_host/resource_dispatcher_host.cc(1098)] OnResponseStarted: chrome://newtab/ The output will be saved to the file chrome_debug.log in Chrome's user data directory (in the parent directory of Default/) for a release build, and in the binary build folder (e.g. out\Debug) for a debug build. On Chrome OS, messages logged by Chrome are written to files within /var/log/chromeat the login screen and to files within the logsubdirectory under the logged-in user's encrypted home directory, which resides under /home/chronos. With --enable-logging=stderrthe output will be printed to standard error (not available on Windows) This file is overwritten each time you restart chrome. To enable logging from the render processes on Windows you also need the --no-sandboxcommand line flag. To see WTF_LOG, use --blink-platform-log-channels Note that: The location of Chrome's user data directory depends on your operating system, and whether you are using Chrome vs Chromium. The above document lists the path to the Default/ directory; the chrome_debug.log file we are interested in is actually one directory above this (i.e. the parent directory) If the environment variable CHROME_LOG_FILE is set, Chrome will write its debug log to its specified location. Example: Setting CHROME_LOG_FILE to "chrome_debug.log" will cause the log file to be written to the Chrome process's current working directory while setting it to "D:\chrome_debug.log" will write the log to the root of your computer's D: drive. To override the log file path in a test harness that runs Chrome, use this pattern: #include "chrome/common/env_vars.h" ... // Set the log file path in the environment for the test browser. std::wstring log_file_path = ...; SetEnvironmentVariable(env_vars::kLogFileName, log_file_path.c_str()); How do I specify the command line flags?See this page.What personal information does the log file contain?Before attaching your chrome_debug.log to a bug report, be aware that it can contain some personal information, such as URLs opened during that session of chrome.Since the debug log is a human-readable text file, you can open it up with a text editor (notepad, vim, etc..) and review the information it contains, and erase anything you don't want the bug investigators to see. The boilerplate values enclosed by brackets on each line are in the format: [process_id:thread_id:ticks_in_microseconds:log_level:file_name(line_number)] SawbuckAlternatively to the above, you can use the Sawbuck utility (for Windows) to view, filter and search the logs in realtime, in a handy-dandy GUI. First download and install the latest version of Sawbuck, launch it, then select "Configure Providers.." form the "Log" menu. This will bring up a dialog that looks something like this: 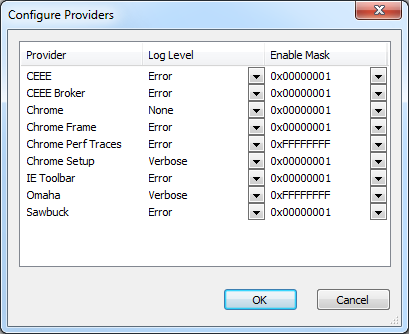 Set the log level for Chrome, Chrome Frame, and/or the Setup program to whatever suits you, and click "OK". You can revisit this dialog at any time to increase or decrease the log verbosity. Now select "Capture" from the "Log" menu, and you should start seeing Chrome's log messages. Note that Sawbuck has a feature that allows you to view the call trace for each log message, which can come in handy when you're trying to home in on a particular problem. Note: If you're installing Sawbuck for the first time, you may need to quit and relaunch your Chrome, as the logging transport used by Sawbuck is only enabled under an environment variable, which is set by the installer. |

相关文章推荐
- 真的只是自己能力不够吗?
- Codeforces 581C Developing Skills 贪心
- QT——GUI软件
- A题感受
- 编程语言发展
- 学生选课系统功能需求
- Unix编程学习笔记--------把一个库下载到系统中,那么这个库到底是什么??? 其内部的机制和原理是什么???
- 开元网站
- ubuntu下编译报错"ld returned 1 exit status"的解决办法
- 页面跳转效果(系统自带)
- hdu 3537 翻硬币 每次能翻1个 或2个 或3个
- 栈
- 使用Vitamio带有缓冲百分比
- druid 配置WebStatFilter 网络url统计
- 快速集成微信支付和支付宝支付
- C++之C语言增强
- 求树的深度--20150926
- 原型模式
- web前端,js实现div隐藏显示
- 内存池的作用--减少内存碎片