视觉显著性
2015-08-24 22:59
387 查看
一、视觉显著性的综述
视觉显著性和相关的认知神经学在过去几十年里已经获得广泛的研究,人类的视觉注意机制能够将有限的认知资源聚集于场景中重要的刺激而抑制那些不重要的信息。在计算机视觉领域,有关显著性的研究在于提出模拟人类视觉注意机制的模型。现有的显著性检测的方法有基于层次的、基于频谱的、基于熵的和基于图像对比度的方法。基于层次的方法采用的是多尺度的图像处理,然后不同层次的结果聚集起来成为最后的显著性映射。基于频谱的方法是把图像分解成Fourier或者Gabor频谱,显著性映射通过选择那些重要的频谱系数来构成的。基于图像对比度的方法是利用指定的子窗口的均值像素亮度值来计算图像中每个像素的对比度,然后由对比度模拟出图像的显著性。二、基于随机抽样的视觉显著性计算方法
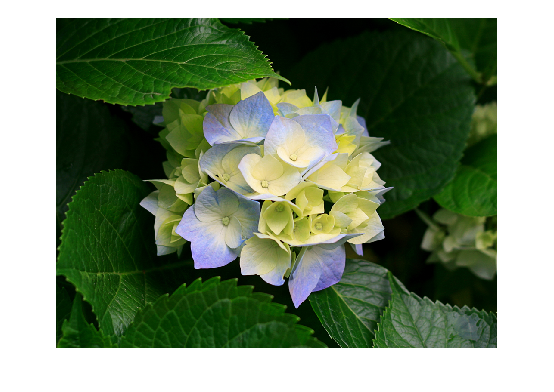
本文的显著性计算方法是先将图像抽样成一些随机的感兴趣区域 (Region of Interest,ROI),然后在这些区域上计算的,其流程如图3. 7所示,对于一幅图像如RGB,第一步用高斯滤波器进行滤波并将RGB空间转换成Lab空间;第二步随机生成n个窗口,对于每个窗口,计算出面积与灰度和的比,即:
(3.9)
然后依据下式计算窗口中每个像素

的显著性映射:
(3.10)
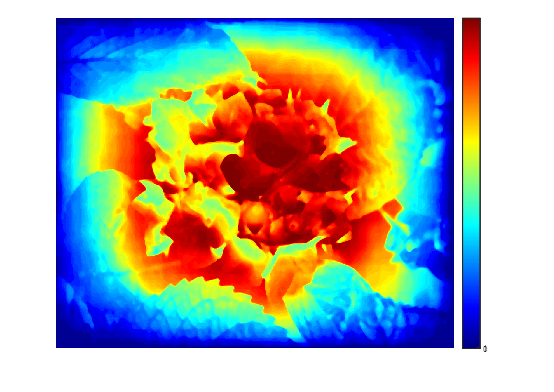
第二步是在三个通道上分别进行的,所以最后的显著性映射要采用欧式距离把颜色空间的显著值融合在一起。

(3.11)
采用这种方法的理由主要是它仅需要调节一个参数,运算时间中等,并且能够在原图上进行操作。

三、matlab源码
主程序close all; clear all; clc;
[fn,pn,fi]=uigetfile('*.*','choose a picture');
img=(imread([pn fn]));
%% 显著性计算
Iseg_gray = Random_Center_Surround_Saliency(img);
%% 画图
figure(1);imshow(img);
figure; imshow(Iseg_gray);
caxis([0 max(max(Iseg_gray))]); axis image, colormap('jet'), colorbar;
axis normal;显著性计算函数:Random_Center_Surround_Saliency
%----------------------------------------------------------
% Vikram T N, Tscherepanow M and Wrede B. A saliency map based on sampling an image into random rectangular regions of interest
% Pattern Recognition (Inpress).
% http://www.sciencedirect.com/science/article/pii/S0031320312000714?v=s5 %----------------------------------------------------------

function [SM] = Random_Center_Surround_Saliency(img)

%---------------------------------------------------------
% Clean the input image for any noise using a Gaussian filter
%---------------------------------------------------------
gfrgb = imfilter(img, fspecial('gaussian', 3, 3), 'symmetric', 'conv');

%---------------------------------------------------------
% Perform sRGB to CIE Lab color space conversion (using D65)
%---------------------------------------------------------
%cform = makecform('srgb2lab', 'AdaptedWhitePoint', whitepoint('d65'));
cform = makecform('srgb2lab');
lab = applycform(gfrgb,cform);

%---------------------------------------------------------
% Compute Lab average values (note that in the paper this
% average is found from the unblurred original image, but
% the results are quite similar)
%---------------------------------------------------------
l = double(lab(:,:,1));
a = double(lab(:,:,2));
b = double(lab(:,:,3));

[r,c] = size(l);

%---------------------------------------------------------
%Initialize the saliency map vectors for L,a and b channels
%---------------------------------------------------------
Map_L(1:r,1:c) = 0.0;
Map_a(1:r,1:c) = 0.0;
Map_b(1:r,1:c) = 0.0;

Map_Points(1:r,1:c) = 0.0;

%---------------------------------------------------------
% n = the number of random rectangles that are in consideration
% n = 1000 should be enough in most cases
% Details of the algorithm are given in the Pattern Recognition article
%---------------------------------------------------------
n = 1000;

 for i=1:n


    x1 = floor(rand()*(r-1))+1;
    y1 = floor(rand()*(c-1))+1;

    x2 = floor(rand()*(r-1))+1;
    y2 = floor(rand()*(c-1))+1;

    if(x2 <r && y2 < c && x1 > 0 && y1 > 0)

    l1 = x1;
    u1 = y1;

    l2 = x2;
    u2 = y2;

    if(x1>x2)
        l1 = x2;
        l2 = x1;
    end

    if(y1>y2)
        u1 = y2;
        u2 = y1;
    end


     ml = mean2(l(l1:l2,u1:u2));
     Map_L(l1:l2,u1:u2) = Map_L(l1:l2,u1:u2) + abs((l(l1:l2,u1:u2) - ml));


     ma = mean2(a(l1:l2,u1:u2));
     Map_a(l1:l2,u1:u2) = Map_a(l1:l2,u1:u2) + abs((a(l1:l2,u1:u2) - ma));

     mb = mean2(b(l1:l2,u1:u2));
     Map_b(l1:l2,u1:u2) = Map_b(l1:l2,u1:u2) + abs((b(l1:l2,u1:u2) - mb));
    end

end

%---------------------------------------------------------
% Fusion of the saliency values from the different channels
%---------------------------------------------------------
sm1 = ((Map_L).^(2) + (Map_a).^(2) + (Map_b).^(2)).^(1/2);

%---------------------------------------------------------
% Median filtering to distribute saliency values
%---------------------------------------------------------
sm1 = medfilt2(sm1,[11 11]);

%---------------------------------------------------------
% Normalize the final saliency map (SM) in [0,255]
%---------------------------------------------------------
SM = uint8(((sm1 - min(sm1(:)))/(max(sm1(:))))*255);

%---------------------------------------------------------
% Perform histogram equalization only if necessary(depending on input image)
SM = histeq(SM);
%---------------------------------------------------------

end
参考文献:
Vikram T N, Tscherepanow M, Wrede B. A saliency map based on sampling an image into random rectangular regions of interest[J]. Pattern Recognition, 2012, 45(9): 3114-3124.

相关文章推荐
- 使用自定义的确认框代替默认的浏览器的确认框
- ajax文本空输入显示用户信息
- 当我们讲故事时,我们在做营销
- 当我们讲故事时,我们在做营销
- 95后营销:4个问题和4个要领
- ACM_SKILLS(Update)
- uva 1292 树形dp
- hdu 1281 棋盘游戏(最大匹配·匈牙利)
- 重构---代码的坏味道
- Struts2: org.apache.catalina.LifecycleException: Failed to start component [StandardEngine[Catalina]
- Set a static file on django
- nide.js(二)文件I/O
- 第一百四十四天 how can I 坚持
- 消息队列
- C++栈学习——顺序栈和链栈的区别
- WCF实战2
- android入门(四) 调试工具DDMS的使用
- QDialog例程
- poj 3678 Katu Puzzle (2-sat)
- Linux shell 内部变量