JBoss调优(四)web服务器线程池调优
2015-07-17 12:31
330 查看
原文:
http://www.mastertheboss.com/jboss-server/jboss-performance/jboss-as-7-performance-tuning?showall=&start=3
There are a large set of tuning aspects which ultimately influence the performance of the web server. One of the most important factors is tuning the HTTP Connector thread pool settings to more closely match the web request load you have. This is difficult
to do, but is very important to get right for best performance.
The amount of threads which are allowed by the web server are referenced through the executor attribute:
?
Then, within the threads subsystem, you can define the number of threads which will be used by the pool, along with the other thread attributes (see Chapter 2, Configuring the Application Server, for more details about the thread subsystem):
?
The most important Connector attributes are defined into the core-threads and
max-threads. Setting these values too low means that you may not have enough threads to handle all of the requests, in which case, requests have to sit idle for some time without being handled until another request thread is freed up. Too low
of a value also means that JBoss Web server will be unable to take advantage of your server machine's hardware.
On the other hand, be careful before increasing these thread counts blindly. By increasing the thread count too much, you will:
• Consume a good chunk of memory
• Your system will spend too much time-context switching
You should, at first, investigate if it's rather a problem of individual requests taking too long. Are your threads returning to the pool? If, for example, database connections are not released, threads pile up waiting to obtain a database connection thereby
making it impossible to process additional requests.
In such a scenario, simply adding more thread will make things even worse by introducing a greater stress on the CPU and on the garbage collector. You can discover this kind of problem by simply taking a thread dump in your application to find out where your
web server threads are stuck. For example, in this picture, taken from JConsole
threads tab, you can see how an idle thread should look like, by looking at its stack trace:
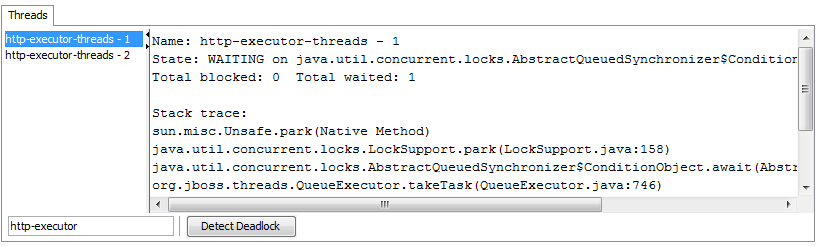
On the other hand, the following HTTP thread is busy at doing input/output operations which could mean, for example, the web server is acquiring data from an external resource.
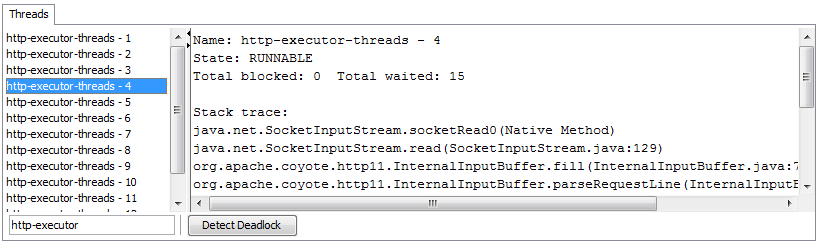
The above snapshots gives you also a clue on how you can monitor the number of web server running threads. Just fill in the executor name (http-executor) in the lower textfield, and you will have a filtered list of all your web server threads.
http://www.mastertheboss.com/jboss-server/jboss-performance/jboss-as-7-performance-tuning?showall=&start=3
Tuning Web server thread pool
There are a large set of tuning aspects which ultimately influence the performance of the web server. One of the most important factors is tuning the HTTP Connector thread pool settings to more closely match the web request load you have. This is difficult
to do, but is very important to get right for best performance.
The amount of threads which are allowed by the web server are referenced through the executor attribute:
?
?
max-threads. Setting these values too low means that you may not have enough threads to handle all of the requests, in which case, requests have to sit idle for some time without being handled until another request thread is freed up. Too low
of a value also means that JBoss Web server will be unable to take advantage of your server machine's hardware.
On the other hand, be careful before increasing these thread counts blindly. By increasing the thread count too much, you will:
• Consume a good chunk of memory
• Your system will spend too much time-context switching
You should, at first, investigate if it's rather a problem of individual requests taking too long. Are your threads returning to the pool? If, for example, database connections are not released, threads pile up waiting to obtain a database connection thereby
making it impossible to process additional requests.
In such a scenario, simply adding more thread will make things even worse by introducing a greater stress on the CPU and on the garbage collector. You can discover this kind of problem by simply taking a thread dump in your application to find out where your
web server threads are stuck. For example, in this picture, taken from JConsole
threads tab, you can see how an idle thread should look like, by looking at its stack trace:
On the other hand, the following HTTP thread is busy at doing input/output operations which could mean, for example, the web server is acquiring data from an external resource.
The above snapshots gives you also a clue on how you can monitor the number of web server running threads. Just fill in the executor name (http-executor) in the lower textfield, and you will have a filtered list of all your web server threads.

相关文章推荐
- 面试中的红黑树问题
- svn 回退/更新/取消至某个版本命令详解
- HashMap存储数据赋值javabean简单示例
- HDU 1061 Rightmost Digit
- 相关文档
- 转:关于C++ const 的全面总结
- JBoss调优(三)EJB连接池调优
- python 变量作用域
- PHP vs Node.js 深入讨论
- Java中static的用法归纳
- 状态模式 State
- OID-----利用SNMP获取、走访节点值【程序代码+分析】
- linux socket 阻塞式 TCP
- 阿里云Centos6.5安装配置docker
- 观察者模式
- Centos7安装Mysql
- 张国祥老师游览中南名胜鸡公山
- php实现简单多进程的方法
- JBoss调优(二)数据库连接池调优
- Myeclipse集成Maven(图文说明)