sobel算子原理以及运用
2015-07-15 13:35
288 查看
Sobel边缘检测算法:
主要用作边缘检测,在技术上,它是一离散性差分算子,用来运算图像亮度函数的灰度之近似值。在图像的任何一点使用此算子,将会产生对应的灰度矢量或是其法矢量
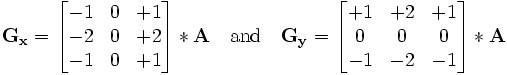
Sobel卷积因子为:
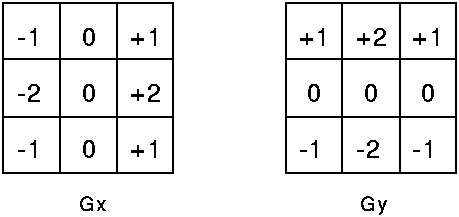
该算子包含两组3x3的矩阵,分别为横向及纵向,将之与图像作平面卷积,即可分别得出横向及纵向的亮度差分近似值。如果以A代表原始图像,Gx及Gy分别代表经横向及纵向边缘检测的图像灰度值,其公式如下:
具体计算如下:
Gx = (-1)*f(x-1, y-1) + 0*f(x,y-1) + 1*f(x+1,y-1)
+(-2)*f(x-1,y) + 0*f(x,y)+2*f(x+1,y)
+(-1)*f(x-1,y+1) + 0*f(x,y+1) + 1*f(x+1,y+1)
= [f(x+1,y-1)+2*f(x+1,y)+f(x+1,y+1)]-[f(x-1,y-1)+2*f(x-1,y)+f(x-1,y+1)]
Gy =1* f(x-1, y-1) + 2*f(x,y-1)+ 1*f(x+1,y-1)
+0*f(x-1,y) 0*f(x,y) + 0*f(x+1,y)
+(-1)*f(x-1,y+1) + (-2)*f(x,y+1) + (-1)*f(x+1, y+1)
= [f(x-1,y-1) + 2f(x,y-1) + f(x+1,y-1)]-[f(x-1, y+1) + 2*f(x,y+1)+f(x+1,y+1)]
其中f(a,b), 表示图像(a,b)点的灰度值;
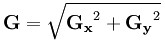
图像的每一个像素的横向及纵向灰度值通过以下公式结合,来计算该点灰度的大小:
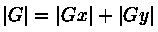
通常,为了提高效率 使用不开平方的近似值:
如果梯度G大于某一阀值 则认为该点(x,y)为边缘点。
然后可用以下公式计算梯度方向:
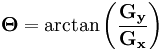
Sobel算子根据像素点上下、左右邻点灰度加权差,在边缘处达到极值这一现象检测边缘。对噪声具有平滑作用,提供较为精确的边缘方向信息,边缘定位精度不够高。当对精度要求不是很高时,是一种较为常用的边缘检测方法。
实验代码:
y = filter(b,a,X) 函数法:
Y = filter2(h,X,shape) returnsthe part of Y specified by the shape parameter. shape isa string with one of these values:
'full'
Returns the full two-dimensional correlation. In thiscase, Y is larger than X.
'same'
(default) Returns the central part of the correlation.In this case, Y is the same size as X.
'valid'
Returns only those parts of the correlation that arecomputed without zero-padded edges. In this case, Y issmaller than X.
代码:
I=imread('lena.jpg');
subplot(2,2,1);
imshow(I);
title('原图像');
Gx=[-1 -2 -1;0 0 0;1 2 1];
Gy=Gx';
GIx=filter2(Gx,I,'same');% same 是代表图像边缘的像素怎么处理,
GIx=abs(GIx);
subplot(2,2,2);
imshow(GIx);
title('x方向的梯度');
GIy=filter2(Gy,I,'same');
GIy=abs(GIy);
subplot(2,2,3);
imshow(GIy);
title('y方向的梯度');
G=GIx+GIy;
subplot(2,2,4);
imshow(G,[]);
title('图像的sobel梯度');
代码的详细过程:
I=imread('lena.jpg');
subplot(2,2,1);
imshow(I);
title('原图像');
Gx=[-1 -2 -1;0 0 0;1 2 1];
Gy=Gx';
[m n]=size(I);
I1=zeros(m,n);
for i=2:m-1
for j=2:n-1
for k=-1:1
for p=-1:1
I1(i,j)= I1(i,j)+I(i+k,j+p)*Gx(k+2,p+2);
end
end
end
end
subplot(2,2,2);
imshow(I1,[]);
title('x方向');
%%
[m n]=size(I);
I2=zeros(m,n);
for i=2:m-1
for j=2:n-1
for k=-1:1
for p=-1:1
I2(i,j)= I2(i,j)+I(i+k,j+p)*Gy(k+2,p+2);
end
end
end
end
subplot(2,2,3);
imshow(I2,[]);
title('y方向');
%% sobel梯度
I3=I1+I2;
subplot(2,2,4);
imshow(I3,[])
主要用作边缘检测,在技术上,它是一离散性差分算子,用来运算图像亮度函数的灰度之近似值。在图像的任何一点使用此算子,将会产生对应的灰度矢量或是其法矢量
Sobel卷积因子为:
该算子包含两组3x3的矩阵,分别为横向及纵向,将之与图像作平面卷积,即可分别得出横向及纵向的亮度差分近似值。如果以A代表原始图像,Gx及Gy分别代表经横向及纵向边缘检测的图像灰度值,其公式如下:
具体计算如下:
Gx = (-1)*f(x-1, y-1) + 0*f(x,y-1) + 1*f(x+1,y-1)
+(-2)*f(x-1,y) + 0*f(x,y)+2*f(x+1,y)
+(-1)*f(x-1,y+1) + 0*f(x,y+1) + 1*f(x+1,y+1)
= [f(x+1,y-1)+2*f(x+1,y)+f(x+1,y+1)]-[f(x-1,y-1)+2*f(x-1,y)+f(x-1,y+1)]
Gy =1* f(x-1, y-1) + 2*f(x,y-1)+ 1*f(x+1,y-1)
+0*f(x-1,y) 0*f(x,y) + 0*f(x+1,y)
+(-1)*f(x-1,y+1) + (-2)*f(x,y+1) + (-1)*f(x+1, y+1)
= [f(x-1,y-1) + 2f(x,y-1) + f(x+1,y-1)]-[f(x-1, y+1) + 2*f(x,y+1)+f(x+1,y+1)]
其中f(a,b), 表示图像(a,b)点的灰度值;
图像的每一个像素的横向及纵向灰度值通过以下公式结合,来计算该点灰度的大小:
通常,为了提高效率 使用不开平方的近似值:
如果梯度G大于某一阀值 则认为该点(x,y)为边缘点。
然后可用以下公式计算梯度方向:
Sobel算子根据像素点上下、左右邻点灰度加权差,在边缘处达到极值这一现象检测边缘。对噪声具有平滑作用,提供较为精确的边缘方向信息,边缘定位精度不够高。当对精度要求不是很高时,是一种较为常用的边缘检测方法。
实验代码:
y = filter(b,a,X) 函数法:
Y = filter2(h,X,shape) returnsthe part of Y specified by the shape parameter. shape isa string with one of these values:
'full'
Returns the full two-dimensional correlation. In thiscase, Y is larger than X.
'same'
(default) Returns the central part of the correlation.In this case, Y is the same size as X.
'valid'
Returns only those parts of the correlation that arecomputed without zero-padded edges. In this case, Y issmaller than X.
代码:
I=imread('lena.jpg');
subplot(2,2,1);
imshow(I);
title('原图像');
Gx=[-1 -2 -1;0 0 0;1 2 1];
Gy=Gx';
GIx=filter2(Gx,I,'same');% same 是代表图像边缘的像素怎么处理,
GIx=abs(GIx);
subplot(2,2,2);
imshow(GIx);
title('x方向的梯度');
GIy=filter2(Gy,I,'same');
GIy=abs(GIy);
subplot(2,2,3);
imshow(GIy);
title('y方向的梯度');
G=GIx+GIy;
subplot(2,2,4);
imshow(G,[]);
title('图像的sobel梯度');
代码的详细过程:
I=imread('lena.jpg');
subplot(2,2,1);
imshow(I);
title('原图像');
Gx=[-1 -2 -1;0 0 0;1 2 1];
Gy=Gx';
[m n]=size(I);
I1=zeros(m,n);
for i=2:m-1
for j=2:n-1
for k=-1:1
for p=-1:1
I1(i,j)= I1(i,j)+I(i+k,j+p)*Gx(k+2,p+2);
end
end
end
end
subplot(2,2,2);
imshow(I1,[]);
title('x方向');
%%
[m n]=size(I);
I2=zeros(m,n);
for i=2:m-1
for j=2:n-1
for k=-1:1
for p=-1:1
I2(i,j)= I2(i,j)+I(i+k,j+p)*Gy(k+2,p+2);
end
end
end
end
subplot(2,2,3);
imshow(I2,[]);
title('y方向');
%% sobel梯度
I3=I1+I2;
subplot(2,2,4);
imshow(I3,[])

相关文章推荐
- Android对话框的生成
- MP系统下的三种中断模式
- mysql5.6主从配置
- GRE写作必备句型
- md5 jsp页面,加密用
- EasyUI改变Layout的Region的宽高,位置等信息
- 关于BAT们的失败,我们现在学到了什么?
- SCI VS SMI
- 如何在一台电脑里面,安装两个操作系统,或者又称为双系统?
- 欢迎使用CSDN-markdown编辑器
- kvm下制作虚拟镜像
- hadoop 运行jar文件
- Eclipse快捷键与使用技巧总结
- ACPI Overview
- LeetCode - Dungeon Game
- C++设计模式-Prototype原型模式
- RapidMiner studio之MainFrame源码分析
- 全面认识APM和ACPI
- Java Vector 源码分析
- ACPI Tables