Firebug: Net Panel 使用详解
2015-06-11 13:31
375 查看
Introduction to Firebug: Net Panel
Since there is not much user documentation related to Firebug features (and there is a lot what to know about) I have decided to put together several posts about existing features.
This post is intended as a detailed explanation of the Net panel from the user perspective. This post is not about developing an extension for this panel or Firebug itself. Also notice that all features described below are available (some of them introduced) in Firebug 1.4.
You'll be surprised how many features is there!


Click the image to get full size.
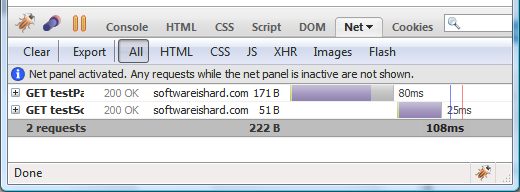
The image above shows the result from a page that sent two network
requests to the server in order to load. The first request is for the
top testPage1.htm document (the page itself) and the second for embedded testScript1.js script file.
If you have Firebug installed enable Net panel and click here to see the example live.
Each entry displays basic info about the request and a graphical Timeline that depicts load phases in time. For now it's enough to say that it took 80ms to load the page testPage.htm and after it was loaded the script file testScript.js started to load, which took another 25ms (see more info about the Timeline below).
Following info is displayed:
HTTP request method (GET).
Response status and description (200 OK).
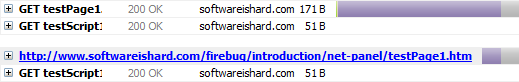
Requested file name (testPage1.htm) And if the mouse cursor moves over it, entire URL is displayed.
Domain name from where the response came from (softwareishard.com).
Size of the response (171 B).
Graphical timeline and load time info (80ms).
There is also a summary info at the bottom of the request list.

This summary simply says:
The page initiated two requests.
The size of the requested data is 222 B.
The total page load time was 108 milliseconds (since the beginning of the first request to the end of the last request).
Not to forget, there is a message at the top of the list explaining
that if the panel isn't enabled nothing is monitored. This is important
since if the user isn't interested in HTTP tracking, there are no
performance penalties if the panel is disabled.

This message is appended into the list of request every time the
panel is disabled and enabled again so, it's obvious that some requests
doesn't have to be displayed.
coming back. No matter if it comes from the server or the browser
cache, one request-response round-trip is represented by one entry in
the list.
Click on the following screenshot to see all headers.
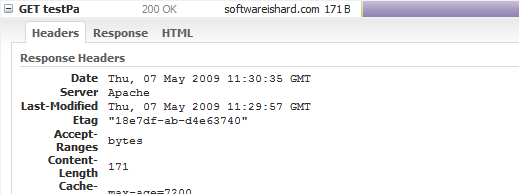
The expanded body has following tabs:
Headers - request and response HTTP headers
Response - data returned from the server.
HTML - preview of an HTML response (available only if the response is an HTML).
The other tabs look like as follows:
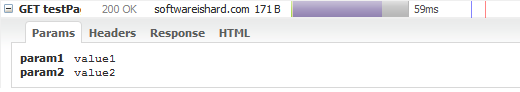
The example above shows parameters for the following URL:
Clik here for live example.
Click here for a live example.
A live example is available.
The image above shows a case when both requests came from the browser cache - response status is 304 Not Modified. Also, the summary row shows amount of data coming from the cache.
Further, there is following info:
Last Modified - last time the cache entry was modified
Last Fetched - last time the cache entry was opened
Expires - expiration time of the cache entry
Data Size - cache entry data size
Fetch Count - number of times the cache entry has been opened
Device - id for the device that stores this cache entry
An example page is here.
Not to forget, in order to have this tab, you need the Firecookie extension installed.
If you move mouse over the graph there is a detailed tooltip info. See the following screenshot:
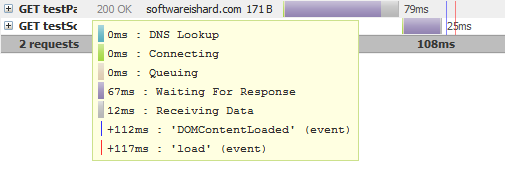
Every request-response round trip is composed from a several phases, represented by different color in the graph:
DNS Lookup - DNS resolution time
Connection - elapsed time required to create a TCP connection
Queuing - elapsed time spent in a browser queue waiting for a network connection
Waiting For Response - waiting for a response from the server
Receiving Data - elapsed time required to read entire response from the server (and/
or time required to read from cache).
DomContentLoaded event - time when DomContentLoad event was fired (since the beginning of the request, can be negative if the request has been started after the event)
load event - time when page load
event was fired (since the beginning of the request, can be negative if
the request has been started after the event)
See also a post dedicated to HTTP timings in Firebug 1.5.
Click the image to enlarge.
As you type into the Firebug search box, an option menu automatically pops up allowing to set a Response Bodies
option so, the panel looks for the searched text even within returned
responses. Entries automatically expand if the text is found inside and
the occurrence is also selected in the UI. The search is automatically case sensitive if the searched text contains any capital letters.

Clear - removes all entries.
Export* - Exports all HTTP tracing data into a HTTP Archive file (*.har)
All (filter) - all requests are displayed.
HTML (filter) - only HTML requests are displayed
CSS (filter) - only CSS requests are displayed
JS (filter) - only Javascript requests are displayed
XHR (filter) - only dynamic requests (using XMLHttpRequest) are displayed
Images (filter) - only image requests are displayed
Flash (filter) - only Flash requests are displayed
* This action comes from a NetExport extension. All collected and computed data presented within the Net panel can be exported in HTTP Archive format (based on JSON). There is also a viewer that can be used to preview existing *.har files.
If you right click on a request entry you should see something like as
follows (the list of actions depends on the type of clicked request):
Copy Location - copy request URL into the clipboard
Copy Request Headers - copy all request headers into the clipboard
Copy Response Headers - copy all response headers into the clipboard
Copy Response Body - copy response body into the clipboard
Open in New Tab - open response in a new browser tab (the request can be sent to the server again)
Open Response in New Tab - open response body in a new tab (cached response is always used)
Since there is not much user documentation related to Firebug features (and there is a lot what to know about) I have decided to put together several posts about existing features.
This post is intended as a detailed explanation of the Net panel from the user perspective. This post is not about developing an extension for this panel or Firebug itself. Also notice that all features described below are available (some of them introduced) in Firebug 1.4.
You'll be surprised how many features is there!
Net Panel Overview
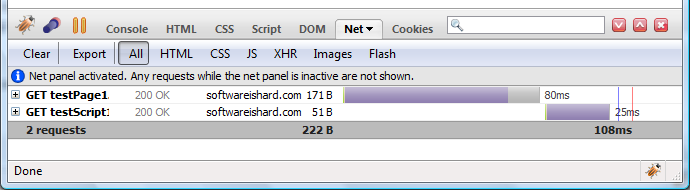
The main purpose of the Net panel is to monitor HTTP traffic initiated by a web page and simply present all collected and computed information to the user. It's content is composed from list of entries where each entry represents one request/response round trip made by the page.
Click the image to get full size.
The image above shows the result from a page that sent two network
requests to the server in order to load. The first request is for the
top testPage1.htm document (the page itself) and the second for embedded testScript1.js script file.
If you have Firebug installed enable Net panel and click here to see the example live.

Each entry displays basic info about the request and a graphical Timeline that depicts load phases in time. For now it's enough to say that it took 80ms to load the page testPage.htm and after it was loaded the script file testScript.js started to load, which took another 25ms (see more info about the Timeline below).
Following info is displayed:
HTTP request method (GET).
Response status and description (200 OK).
Requested file name (testPage1.htm) And if the mouse cursor moves over it, entire URL is displayed.
Domain name from where the response came from (softwareishard.com).
Size of the response (171 B).
Graphical timeline and load time info (80ms).
There is also a summary info at the bottom of the request list.
This summary simply says:
The page initiated two requests.
The size of the requested data is 222 B.
The total page load time was 108 milliseconds (since the beginning of the first request to the end of the last request).
Not to forget, there is a message at the top of the list explaining
that if the panel isn't enabled nothing is monitored. This is important
since if the user isn't interested in HTTP tracking, there are no
performance penalties if the panel is disabled.
This message is appended into the list of request every time the
panel is disabled and enabled again so, it's obvious that some requests
doesn't have to be displayed.
Net Request & Response Details
Every request entry can be expanded by clicking on the left hand plus button in order to see additional info. It's important to note that the entry actually represents both: the request sent to the server and also the responsecoming back. No matter if it comes from the server or the browser
cache, one request-response round-trip is represented by one entry in
the list.
Click on the following screenshot to see all headers.
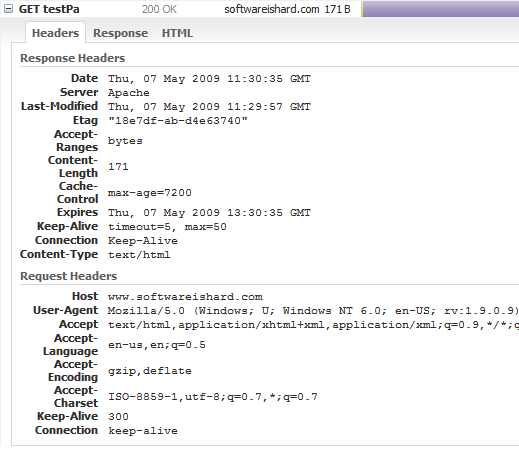
The expanded body has following tabs:
Headers - request and response HTTP headers
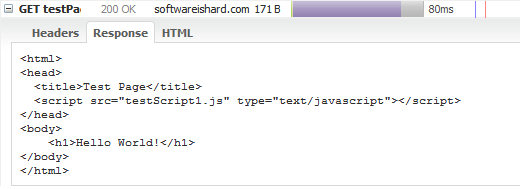
Response - data returned from the server.
HTML - preview of an HTML response (available only if the response is an HTML).
The other tabs look like as follows:
 |  |
URL Parameters
If a network request uses a query string (URL parameters), another Params tab is available providing tabular info about all specified parameters.The example above shows parameters for the following URL:
http://www.softwareishard.com/firebug/introduction/net-panel/testPage1.htm?param1=value1¶m2=value2
Clik here for live example.
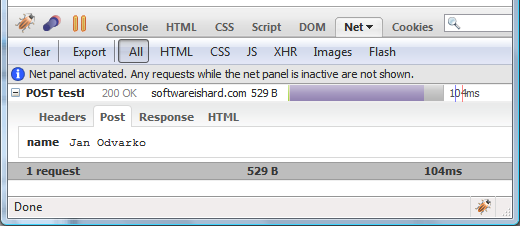
POST & PUT Requests
If the requests is sending any data using POST or PUT HTTP method, there is another tab with sent data.Click here for a live example.
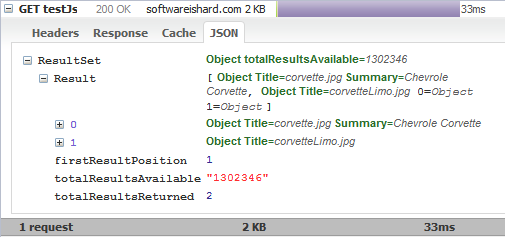
JSON Responses
In case of a JSON response, there is yet another tab that uses expandable hierarchical tree to display all received data.A live example is available.
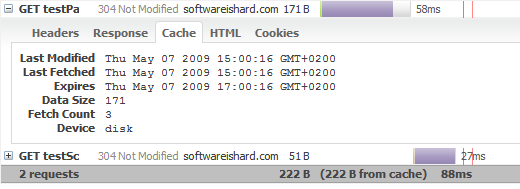
Browser Cache
If a network response comes from the browser cache, there is a Cache tab, showing an info that is related to the appropriate cache-entry.The image above shows a case when both requests came from the browser cache - response status is 304 Not Modified. Also, the summary row shows amount of data coming from the cache.
Further, there is following info:
Last Modified - last time the cache entry was modified
Last Fetched - last time the cache entry was opened
Expires - expiration time of the cache entry
Data Size - cache entry data size
Fetch Count - number of times the cache entry has been opened
Device - id for the device that stores this cache entry
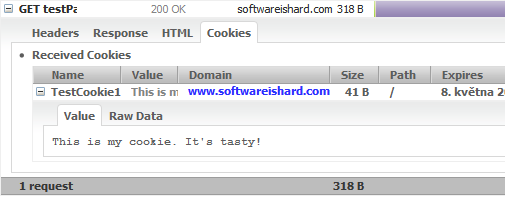
Cookies
There can be also other tabs coming from Firebug extensions. An example is a Cookies tab that shows all send and received cookies for a request. This tab comes from a Firecookie extension.An example page is here.
Not to forget, in order to have this tab, you need the Firecookie extension installed.
Timeline
One of the most useful features for debugging page load performance is a request Timeline. Net panel uses this graphical representation to show request load in time together with timing data.If you move mouse over the graph there is a detailed tooltip info. See the following screenshot:
Every request-response round trip is composed from a several phases, represented by different color in the graph:
DNS Lookup - DNS resolution time
Connection - elapsed time required to create a TCP connection
Queuing - elapsed time spent in a browser queue waiting for a network connection
Waiting For Response - waiting for a response from the server
Receiving Data - elapsed time required to read entire response from the server (and/
or time required to read from cache).
DomContentLoaded event - time when DomContentLoad event was fired (since the beginning of the request, can be negative if the request has been started after the event)
load event - time when page load
event was fired (since the beginning of the request, can be negative if
the request has been started after the event)
See also a post dedicated to HTTP timings in Firebug 1.5.
Search
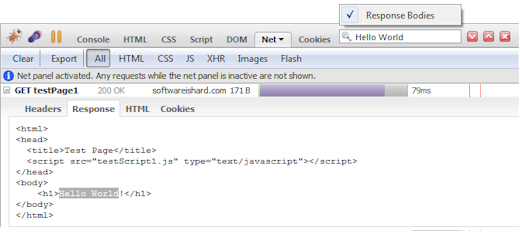
The net panel also uses Firebug's Search Box that can be used to search panel's content and also response bodies.
Click the image to enlarge.
As you type into the Firebug search box, an option menu automatically pops up allowing to set a Response Bodies
option so, the panel looks for the searched text even within returned
responses. Entries automatically expand if the text is found inside and
the occurrence is also selected in the UI. The search is automatically case sensitive if the searched text contains any capital letters.
Toolbar
Let's also quickly explain all the available toolbar buttons.Clear - removes all entries.
Export* - Exports all HTTP tracing data into a HTTP Archive file (*.har)
All (filter) - all requests are displayed.
HTML (filter) - only HTML requests are displayed
CSS (filter) - only CSS requests are displayed
JS (filter) - only Javascript requests are displayed
XHR (filter) - only dynamic requests (using XMLHttpRequest) are displayed
Images (filter) - only image requests are displayed
Flash (filter) - only Flash requests are displayed
* This action comes from a NetExport extension. All collected and computed data presented within the Net panel can be exported in HTTP Archive format (based on JSON). There is also a viewer that can be used to preview existing *.har files.
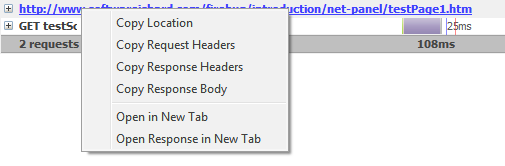
Context Menu
There is also several useful actions available in a request context menu.If you right click on a request entry you should see something like as
follows (the list of actions depends on the type of clicked request):
Copy Location - copy request URL into the clipboard
Copy Request Headers - copy all request headers into the clipboard
Copy Response Headers - copy all response headers into the clipboard
Copy Response Body - copy response body into the clipboard
Open in New Tab - open response in a new browser tab (the request can be sent to the server again)
Open Response in New Tab - open response body in a new tab (cached response is always used)

相关文章推荐
- 24式太极拳:3D动画演示(图文)
- 利用jquery实现滚动图片
- Linux学习笔记(06-11)POSIX消息队列
- XML基础知识学习
- To_review_100_0---堆的整理
- 中国互联网的11种盈利模式
- 常用的OCI函数
- map/reduce
- iOS 常用尺寸
- 【转载】How to build and run your first deep learning network
- Navicat for MySQL连接mysql数据库提示1130错误
- ROS下用gmapping 构建实验室地图的实现
- 每天进步一点点——五分钟理解一致性哈希算法(consistent hashing)
- Android Studio个人常用快捷键
- oracle 中oci 关于null 的处理方法
- MySQL greatest 和 least
- string对象操作
- stringstream中clear()和str(”“)的区别
- 最长回文
- 天题系列: Palindrome Partitioning II