Profiling with Traceview and dmtracedump
2015-03-05 11:13
225 查看
Traceview is a graphical viewer for execution logs that you create by using the
to log tracing information in your code. Traceview can help you debug your application and profile its performance.
A timeline panel -- describes when each thread and method started
and stopped
A profile panel -- provides a summary of what happened inside
a method
The sections below provide addition information about the traceview output panes.
Figure 1 shows a close up of the timeline panel. Each thread’s execution is shown in its own row, with time increasing to the right. Each method is shown in another color (colors are reused in a round-robin fashion starting with the methods that have the most
inclusive time). The thin lines underneath the first row show the extent (entry to exit) of all the calls to the selected method.

Figure 1. The Traceview Timeline Panel
Figure 2 shows the profile pane, a summary of all the time spent in a method. The table shows both the inclusive and exclusive times (as well as the percentage of the total time). Exclusive time is the time spent in the method. Inclusive time is the time spent
in the method plus the time spent in any called functions. We refer to calling methods as "parents" and called methods as "children." When a method is selected (by clicking on it), it expands to show the parents and children. Parents are shown with a purple
background and children with a yellow background. The last column in the table shows the number of calls to this method plus the number of recursive calls. The last column shows the number of calls out of the total number of calls made to that method. In this
view, we can see that there were 14 calls to
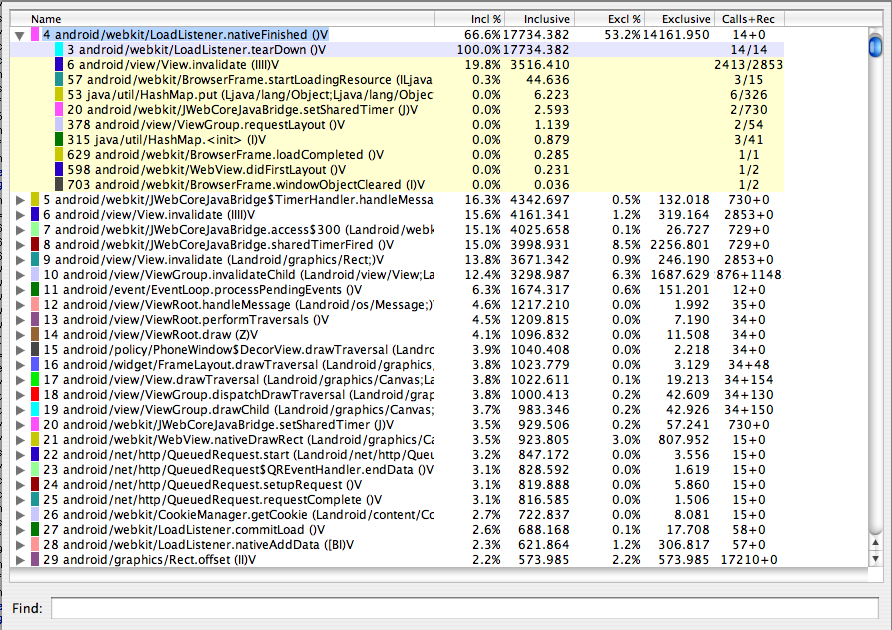
Figure 2. The Traceview Profile Panel
To use Traceview, you need to generate log files containing the trace information you want to analyze.
There are two ways to generate trace logs:
Include the
in your code and call its methods such as
to start and stop logging of trace information to disk. This option is very precise because you can specify exactly where to start and stop logging trace data in your code.
Use the method profiling feature of DDMS to generate trace logs. This option is less precise because you do not modify code, but rather specify when to start and stop logging with DDMS. Although you have less control on exactly
where logging starts and stops, this option is useful if you don't have access to the application's code, or if you do not need precise log timing.
Before you start generating trace logs, be aware of the following restrictions:
If you are using the
your application must have permission to write to external storage (
If you are using DDMS:
Android 2.1 and earlier devices must have an SD card present and your application must have permission to write to the SD card.
Android 2.2 and later devices do not need an SD card. The trace log files are streamed directly to your development machine.
This document focuses on using the
to generate trace data. For more information on using DDMS to generate trace data, see Using the Dalvik Debug Monitor
Server.
To create the trace files, include the
and call one of the
In the call, you specify a base name for the trace files that the system generates. To stop tracing, call
These methods start and stop method tracing across the entire virtual machine. For example, you could call
your activity's
and call
that activity's
When your application calls
the system creates a file called
The system then begins buffering the generated trace data, until your application calls
at which time it writes the buffered data to the output file. If the system reaches the maximum buffer size before you call
the system stops tracing and sends a notification to the console.
Interpreted code runs more slowly when profiling is enabled. Don't try to generate absolute timings from the profiler results (such as, "function X takes 2.5 seconds to run"). The times are only useful in relation to other profile output, so you can see if
changes have made the code faster or slower relative to a previous profiling run.
After your application has run and the system has created your trace files
can use
host machine:
To run Traceview and view the trace files, enter
Note: If you are trying to view the trace logs of an application that is built with ProGuard enabled (release mode build), some method and member names might be obfuscated. You can use the Proguard
to figure out the original unobfuscated names. For more information on this file, see the Proguard documentation.
output, so you need to install Graphviz before running dmtracedump.
The dmtracedump tool generates the call stack data as a tree diagram, with each call represented as a node. It shows call flow (from parent node to child nodes) using arrows. The diagram below shows an example of dmtracedump output.

Figure 3. Screenshot of dmtracedump
For each node, dmtracedump shows
The usage for dmtracedump is:
The tool then loads trace log data from
the options for dmtracedump.
ThreadsTraceview logging does not handle threads well, resulting in these two problems:
If a thread exits during profiling, the thread name is not emitted;
The VM reuses thread IDs. If a thread stops and another starts, they may get the same ID.
Debugclass
to log tracing information in your code. Traceview can help you debug your application and profile its performance.
Traceview Layout
When you have a trace log file (generated by adding tracing code to your application or by DDMS), you can load the log files in Traceview, which displays the log data in two panels:A timeline panel -- describes when each thread and method started
and stopped
A profile panel -- provides a summary of what happened inside
a method
The sections below provide addition information about the traceview output panes.
Timeline Panel
Figure 1 shows a close up of the timeline panel. Each thread’s execution is shown in its own row, with time increasing to the right. Each method is shown in another color (colors are reused in a round-robin fashion starting with the methods that have the mostinclusive time). The thin lines underneath the first row show the extent (entry to exit) of all the calls to the selected method.
Figure 1. The Traceview Timeline Panel
Profile Panel
Figure 2 shows the profile pane, a summary of all the time spent in a method. The table shows both the inclusive and exclusive times (as well as the percentage of the total time). Exclusive time is the time spent in the method. Inclusive time is the time spentin the method plus the time spent in any called functions. We refer to calling methods as "parents" and called methods as "children." When a method is selected (by clicking on it), it expands to show the parents and children. Parents are shown with a purple
background and children with a yellow background. The last column in the table shows the number of calls to this method plus the number of recursive calls. The last column shows the number of calls out of the total number of calls made to that method. In this
view, we can see that there were 14 calls to
LoadListener.nativeFinished();looking at the timeline panel shows that one of those calls took an unusually long time.
Figure 2. The Traceview Profile Panel
Creating Trace Files
To use Traceview, you need to generate log files containing the trace information you want to analyze.There are two ways to generate trace logs:
Include the
Debugclass
in your code and call its methods such as
startMethodTracing()and
stopMethodTracing(),
to start and stop logging of trace information to disk. This option is very precise because you can specify exactly where to start and stop logging trace data in your code.
Use the method profiling feature of DDMS to generate trace logs. This option is less precise because you do not modify code, but rather specify when to start and stop logging with DDMS. Although you have less control on exactly
where logging starts and stops, this option is useful if you don't have access to the application's code, or if you do not need precise log timing.
Before you start generating trace logs, be aware of the following restrictions:
If you are using the
Debugclass,
your application must have permission to write to external storage (
READ_EXTERNAL_STORAGE).
If you are using DDMS:
Android 2.1 and earlier devices must have an SD card present and your application must have permission to write to the SD card.
Android 2.2 and later devices do not need an SD card. The trace log files are streamed directly to your development machine.
This document focuses on using the
Debugclass
to generate trace data. For more information on using DDMS to generate trace data, see Using the Dalvik Debug Monitor
Server.
To create the trace files, include the
Debugclass
and call one of the
startMethodTracing()methods.
In the call, you specify a base name for the trace files that the system generates. To stop tracing, call
stopMethodTracing().
These methods start and stop method tracing across the entire virtual machine. For example, you could call
startMethodTracing()in
your activity's
onCreate()method,
and call
stopMethodTracing()in
that activity's
onDestroy()method.
// start tracing to "/sdcard/calc.trace"
Debug.startMethodTracing("calc");
// ...
// stop tracing
Debug.stopMethodTracing();
When your application calls
startMethodTracing(),
the system creates a file called
<trace-base-name>.trace. This contains the binary method trace data and a mapping table with thread and method names.
The system then begins buffering the generated trace data, until your application calls
stopMethodTracing(),
at which time it writes the buffered data to the output file. If the system reaches the maximum buffer size before you call
stopMethodTracing(),
the system stops tracing and sends a notification to the console.
Interpreted code runs more slowly when profiling is enabled. Don't try to generate absolute timings from the profiler results (such as, "function X takes 2.5 seconds to run"). The times are only useful in relation to other profile output, so you can see if
changes have made the code faster or slower relative to a previous profiling run.
Copying Trace Files to a Host Machine
After your application has run and the system has created your trace files <trace-base-name>.traceon a device or emulator, you must copy those files to your development computer. You
can use
adb pullto copy the files. Here's an example that shows how to copy an example file, calc.trace, from the default location on the emulator to the /tmp directory on the emulator
host machine:
adb pull /sdcard/calc.trace /tmp
Viewing Trace Files in Traceview
To run Traceview and view the trace files, enter traceview <trace-base-name>. For example, to run Traceview on the example files copied in the previous section, use:
traceview /tmp/calc
Note: If you are trying to view the trace logs of an application that is built with ProGuard enabled (release mode build), some method and member names might be obfuscated. You can use the Proguard
mapping.txtfile
to figure out the original unobfuscated names. For more information on this file, see the Proguard documentation.
Using dmtracedump
dmtracedumpis a tool that gives you an alternate way of generating graphical call-stack diagrams from trace log files. The tool uses the Graphviz Dot utility to create the graphical
output, so you need to install Graphviz before running dmtracedump.
The dmtracedump tool generates the call stack data as a tree diagram, with each call represented as a node. It shows call flow (from parent node to child nodes) using arrows. The diagram below shows an example of dmtracedump output.
Figure 3. Screenshot of dmtracedump
For each node, dmtracedump shows
<ref> callname (<inc-ms>, <exc-ms>,<numcalls>), where
<ref>-- Call reference number, as used in trace logs
<inc-ms>-- Inclusive elapsed time (milliseconds spent in method, including all child methods)
<exc-ms>-- Exclusive elapsed time (milliseconds spent in method, not including any child methods)
<numcalls>-- Number of calls
The usage for dmtracedump is:
dmtracedump [-ho] [-s sortable] [-d trace-base-name] [-g outfile] <trace-base-name>
The tool then loads trace log data from
<trace-base-name>.dataand
<trace-base-name>.key. The table below lists
the options for dmtracedump.
| Option | Description |
|---|---|
-d <trace-base-name> | Diff with this trace name |
-g <outfile> | Generate output to <outfile> |
-h | Turn on HTML output |
-o | Dump the trace file instead of profiling |
-d <trace-base-name> | URL base to the location of the sortable javascript file |
-t <percent> | Minimum threshold for including child nodes in the graph (child's inclusive time as a percentage of parent inclusive time). If this option is not used, the default threshold is 20%. |
Traceview Known Issues
ThreadsTraceview logging does not handle threads well, resulting in these two problems:If a thread exits during profiling, the thread name is not emitted;
The VM reuses thread IDs. If a thread stops and another starts, they may get the same ID.

相关文章推荐
- Profiling with Traceview and dmtracedump
- adb开发工具合集(traceview and dmtracedump)
- android traceview and dmtracedump使用
- Android.DebugTools.Traceview & dmtracedump
- With commons logging and Log4j, miss the TRACE level
- ViewState 简述一(With Example And Apply to Asp.net)
- DM*** and Easy *** Server with ISAKMP Profiles
- 电子书下载:Pro WPF and Silverlight MVVM: Effective Application Development with Model-View-ViewModel
- Java memory profiling with jmap and jhat
- ui page control and scrollview with indicator at bottom
- Android代码调试工具 traceview 和 dmtracedump的波折演绎
- How to generate core dump file and debug with it?
- xcode uiscrollview with paging and zoom
- Tip/Trick: Implement Copy Function with FormView and SqlDatasource
- Android代码调试工具 traceview 和 dmtracedump的波折演绎
- Android代码调试工具 traceview 和 dmtracedump的波折演绎
- Android代码调试工具 traceview 和 dmtracedump的波折演绎
- With commons loggin and Log4j, the TRACE level is replaced with DEBUG level.
- Android代码调试工具 traceview 和 dmtracedump的波折演绎
- ViewState 简述一(With Example And Apply to Asp.net)