nagios通过SNMP服务的网络监控
2015-02-07 14:48
399 查看
nagios通过SNMP服务的网络监控,当达到某个设定的值,那么就报警
http://bbotte.blog.51cto.com/6205307/1403997 nagios服务端和客户端的安装配置
http://bbotte.blog.51cto.com/6205307/1583484 Nagios结合pnp4nagios图形监控
借助于网上提供的资源,做下面的操作
https://github.com/cloved/check_traffic/releases 下载最新版本的shell脚本
下载check_traffic.sh V1.4.0,在附件已经上传
#被监控端/客户端
PNP4Nagios Version 0.6.24
Please check the documentation for information about the following error.
XML
file
"/usr/local/pnp4nagios/var/perfdata/192_168_1_2/check_network.xml" not
found. <a href="http://docs.pnp4nagios.org/faq/6">Read FAQ
online</a>
file [line]:
application/models/data.php [312]:
back
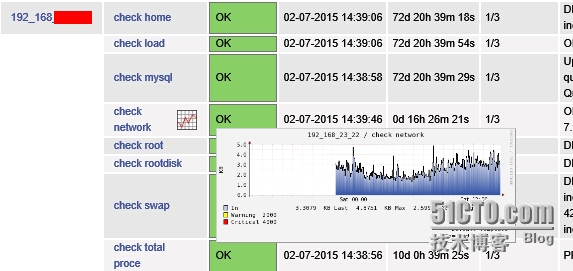
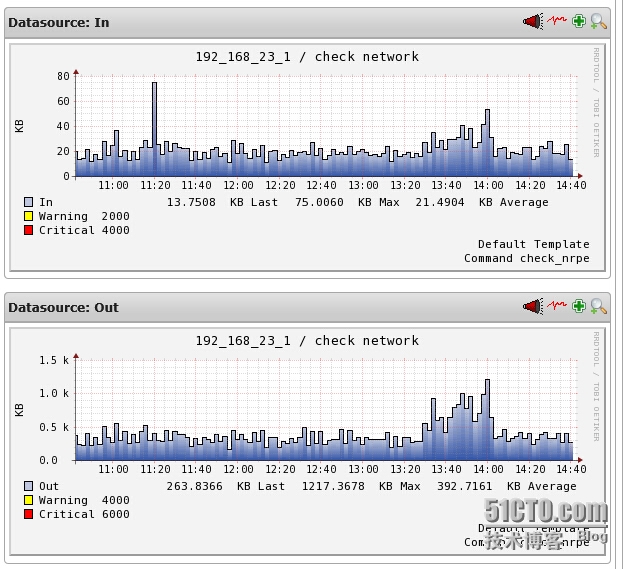
在nagios页面会看到
此图会有in,out的网卡流量,可以在服务器ifstat验证
此外,http://nagios.manubulon.com/ 这个网站也值得一看,里面有 http://nagios.manubulon.com/check_snmp_int.pl 脚本,同样可以实现对网络的监控
附件:http://down.51cto.com/data/2365405
http://bbotte.blog.51cto.com/6205307/1403997 nagios服务端和客户端的安装配置
http://bbotte.blog.51cto.com/6205307/1583484 Nagios结合pnp4nagios图形监控
借助于网上提供的资源,做下面的操作
https://github.com/cloved/check_traffic/releases 下载最新版本的shell脚本
下载check_traffic.sh V1.4.0,在附件已经上传
#被监控端/客户端
cd /usr/local/nagios/libexec/  #下载此脚本
chmod 755 check_traffic.sh
# yum install net-snmp-utils net-snmp net-snmp-libs bc -y  #因脚本里面需要用到bc
# mv /etc/snmp/snmpd.conf /etc/snmp/snmpd.conf.bak
# vim /etc/snmp/snmpd.conf                                 #配置snmp服务
# cat /etc/snmp/snmpd.conf|grep -v ^\# |sed '/^$/d'
com2sec notConfigUser  default       public
group   notConfigGroup v1           notConfigUser
group   notConfigGroup v2c           notConfigUser
view    systemview    included   .1.3.6.1.2.1.1
view    systemview    included   .1.3.6.1.2.1.25.1.1
access  notConfigGroup ""      any       noauth    exact  all none none
view all    included  .1                               80
view mib2   included  .iso.org.dod.internet.mgmt.mib-2 fc
access notConfigGroup ""      any       noauth    exact  all none none
syslocation Unknown (edit /etc/snmp/snmpd.conf)
syscontact Root <root@localhost> (configure /etc/snmp/snmp.local.conf)
dontLogTCPWrappersConnects yes

# service snmpd start
# snmpd -L                                                  #测试snmp配置文件
Error opening specified endpoint ""
Server Exiting with code 1
# ./check_traffic.sh -V 2c -C public -H localhost -L -vvvv  #测试本机的网口,主要的数值是index后面的数字
List Interface for host localhost.
Interface index 1 orresponding to  lo
Interface index 2 orresponding to  eth0
Interface index 3 orresponding to  eth1

# ./check_traffic.sh -V 2c -C public -H 127.0.0.1 -I 2 -w 2000,3000 -c 3001,5000 -K –B
OK - It is the first time of this plugins to run, or some data file lost. We will get the data from the next time.

# ll /var/tmp/check_traffic_127.0.0.1_2__itnms.hist_dat_64   #检查权限,所属用户和组都为nagios
#此脚本有帮助说明,用-h查看,上面 -I 2 即是对eth0做监控,-w 2000,3000是流入2000K/s,或发送3000K/s会提示warning
# -V    1|2c|3
#    Specify the version of snmp
#
# -C    Community
#    Specify the Community
#
# -H    host
#    Specify the host
#
# -6    Use 64 bit counter, ifHC*  instead of if*.
#
# -r    Use Range instead of single value in warning and critical Threshold;
#
# -I    interface
#    Specify the interface
#
# -N    interface name
#    Specify the interface name
#
# -L    List all Interfaces on specify host
#
# -B/b  Switch to B/s or bps, default is -b, bps
#
# -K/M  Switch to K or M (bsp,B/s), default is -K
#被监控端/客户端
vim /usr/local/nagios/etc/nrpe.cfg
command[check_traffic]=/usr/local/nagios/libexec/check_traffic.sh -V 2c -C public -H 127.0.0.1 -I 2 -w 2000,4000 -c 4000,6000 -K -B
# service nrped restart
#监控端/服务端
vim /usr/local/nagios/etc/objects/linuxhost.cfg
define host{
use                     mylinux-server,service-pnp
host_name               192_168_23_2
alias                   server tongji
address                 192.168.23.2
}

vim /usr/local/nagios/etc/objects/linux13.cfg
define service{
use                             linux-service,service-pnp
host_name                       192_168_1_2
service_description             check network
check_command                   check_nrpe!check_traffic
}
完事把nagios重启一下,刚开始会搜集数据,如下面的提示 大概2分钟就能看到图形界面了,PNP4Nagios Version 0.6.24
Please check the documentation for information about the following error.
XML
file
"/usr/local/pnp4nagios/var/perfdata/192_168_1_2/check_network.xml" not
found. <a href="http://docs.pnp4nagios.org/faq/6">Read FAQ
online</a>
file [line]:
application/models/data.php [312]:
back
在nagios页面会看到
此图会有in,out的网卡流量,可以在服务器ifstat验证
此外,http://nagios.manubulon.com/ 这个网站也值得一看,里面有 http://nagios.manubulon.com/check_snmp_int.pl 脚本,同样可以实现对网络的监控
附件:http://down.51cto.com/data/2365405

相关文章推荐
- 通过nagios监控网络总出口流量异常时自动触发抓包行为20130515
- Wikipedia网络的服务监控 Nagios
- Nagios通过check_http监控一台web应用服务器上多个tomcat服务
- 通过Nagios监控Weblogic服务
- 网络监控软件Nagios, Nagios是一款开源的免费网络监视工具,能有效监控Windows、Linux和Unix的主机状态,交换机路由器等网络设备,打印机等。在系统或服务状态异常时发出邮件或短信报
- 用nagios来监控网络服务器和网络服务
- 通过Nagios监控Tomcat服务
- 使用NAGIOS监控网络、系统及服务
- 通过Nagios监控Weblogic服务
- 从配置文件看Nagios通过NRPE, SNMP进行监控的工作原理
- 通过Nagios监控Weblogic服务(续)--优化调整脚本
- 通过改变网络拓扑使用Sniffer Pro监控、分析协议的示意图
- 通过改变网络拓扑使用Sniffer Pro监控、分析协议的示意图
- 通过改变网络拓扑使用Sniffer Pro监控、分析协议的示意图
- 通过改变网络拓扑使用Sniffer Pro监控、分析协议的示意图
- 通过改变网络拓扑使用Sniffer Pro监控、分析协议的示意图
- Nagios:中大型网络服务器监控软件
- 通过改变网络拓扑使用Sniffer Pro监控、分析协议的示意图
- 通过改变网络拓扑使用Sniffer Pro监控、分析协议的示意图
- 通过改变网络拓扑使用Sniffer Pro监控、分析协议的示意图