Sequence of shopping carts in-depth analysis with R(2) – Clustering
2015-01-30 09:02
417 查看
This is the second part of the in-depth sequence analysis. In
the previous post, we processed data in the required format, plotted a Sankey diagram, and did some distribution, frequency, time lapse and entropy analysis with visualization. For dessert, clustering! Clustering is an exploratory data analysis method aimed
at finding automatically homogeneous groups or clusters in the data. It simplifies the large number of distinct sequences in a few types of trajectories.
Let’s assume that we want to identify four segments of customers based on their behavior (purchase sequences). We will use the hierarchical clustering method Ward for clustering our customers with the following code:
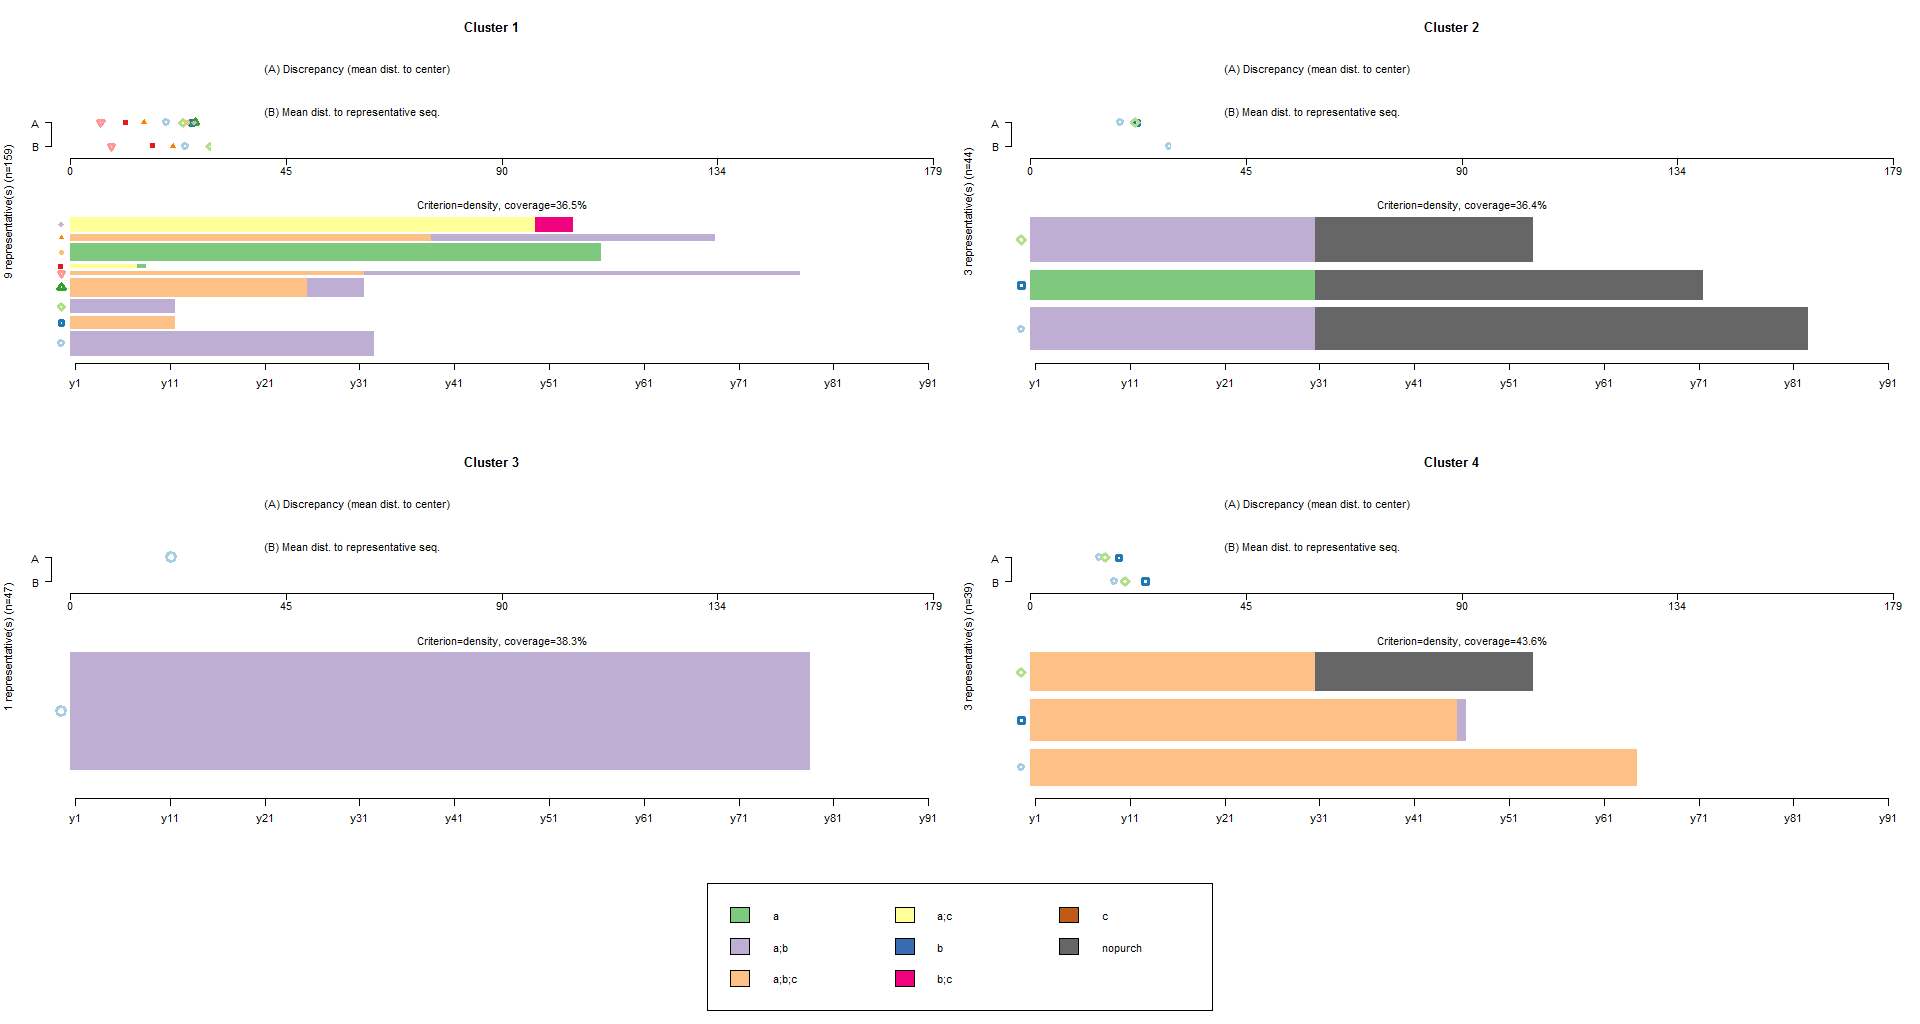
Once we have identified clusters, we can plot three types of graphics we are familiar with from
the previous post. These grafics can help us to identify the typical patterns that characterize the clusters. We will start with a distribution analysis for each cluster which shows the state distribution at each time point (the columns of the sequence
object), continue with a frequency plot, and finish with a mean time spent in each state plot:


It is also possible an advanced approach of clustering. The command below finds and plots the representative set that, with a neighborhood radius of 10% (default tsim value), covers at least 35% (trep parameter) of the sequences
in each of the four cl4.lab groups:

In the resulting plot the selected representative sequences are plotted bottom-up according to their representativeness score with a bar width proportional to the number of sequences assigned to them. At the top of the plot, two
parallel series of symbols standing each for a representative sequence are displayed horizontally on a scale ranging from 0 to the maximal theoretical distance Dmax. The location of the symbol associated with the representative sequence indicates on axis A
the discrepancy within the subset of sequences and on axis B the mean distance to the representative sequence.
We learn from the plots that nine, three, one and three representatives, respectively, are necessary for each of the four groups to achieve the 35% coverage and that the actual coverage is 36.5%, 36.4%, 38.3% and 43.6%, respectively.
So, what is the main point of preceding analysis? We can use it for:
Defining customers who left our company using solutions I mentioned in
the previous post and intending to recover them;
Both predicting customer’s sequences and intending to affect them by recommending the right product at the right time during the customer’s life-time. The right product best matches another one and leads to increase customer’s life-time value;
Defining unsuccessful combination of products/carts;
Clustering customers based on their sequences and working with homogeneous segments;
and so on.
Be sociable, share this post!
the previous post, we processed data in the required format, plotted a Sankey diagram, and did some distribution, frequency, time lapse and entropy analysis with visualization. For dessert, clustering! Clustering is an exploratory data analysis method aimed
at finding automatically homogeneous groups or clusters in the data. It simplifies the large number of distinct sequences in a few types of trajectories.
Let’s assume that we want to identify four segments of customers based on their behavior (purchase sequences). We will use the hierarchical clustering method Ward for clustering our customers with the following code:
the previous post. These grafics can help us to identify the typical patterns that characterize the clusters. We will start with a distribution analysis for each cluster which shows the state distribution at each time point (the columns of the sequence
object), continue with a frequency plot, and finish with a mean time spent in each state plot:


It is also possible an advanced approach of clustering. The command below finds and plots the representative set that, with a neighborhood radius of 10% (default tsim value), covers at least 35% (trep parameter) of the sequences
in each of the four cl4.lab groups:
In the resulting plot the selected representative sequences are plotted bottom-up according to their representativeness score with a bar width proportional to the number of sequences assigned to them. At the top of the plot, two
parallel series of symbols standing each for a representative sequence are displayed horizontally on a scale ranging from 0 to the maximal theoretical distance Dmax. The location of the symbol associated with the representative sequence indicates on axis A
the discrepancy within the subset of sequences and on axis B the mean distance to the representative sequence.
We learn from the plots that nine, three, one and three representatives, respectively, are necessary for each of the four groups to achieve the 35% coverage and that the actual coverage is 36.5%, 36.4%, 38.3% and 43.6%, respectively.
So, what is the main point of preceding analysis? We can use it for:
Defining customers who left our company using solutions I mentioned in
the previous post and intending to recover them;
Both predicting customer’s sequences and intending to affect them by recommending the right product at the right time during the customer’s life-time. The right product best matches another one and leads to increase customer’s life-time value;
Defining unsuccessful combination of products/carts;
Clustering customers based on their sequences and working with homogeneous segments;
and so on.
Be sociable, share this post!

相关文章推荐
- Sequence of shopping carts in-depth analysis with R(3)– Sequence of events
- Sequence of shopping carts in-depth analysis with R(1)
- Sequence of shopping carts analysis with R(0) – Sankey diagram
- In-depth analysis of Oracle memory
- The first in-depth technical analysis of VP8
- An in depth analysis of ASProtect 2.22 by zyzygy
- You cannot run the non-logged version of bulk copy in this database. Please check with the DBO. 问题的解决方法
- Web Tier to Go With Java EE 5: Summary of New Features in JavaServer Faces 1.2 Technology
- Web Tier to Go With Java EE 5: Summary of New Features in Java Standard Tag Library (JSTL) 1.2
- Dynamic Generation of Word Document Report in ASP.NET with HTML
- Mac OS X:Analysis of the Use of the Boot Server Discovery Protocol in NetBoot
- Count the depth of the stack in JVM.
- The name or security ID (SID) of the domain specified is inconsistent with the trust information for that domain
- Any problem in computer science can be solved with another layer of indirection
- 【LeetCode with Python】 Minimum Depth of Binary Tree
- the name or security ID(SID) of the domain specified is inconsistent with the trust information for that domain
- WinForms UI Thread Invokes: An In-Depth Review of Invoke/BeginInvoke/InvokeRequred
- The Best of Both Worlds: Integrating JSF with Struts in Your J2EE Applications
- summary with him in half of year
- Teddy's Aspect Weaver Version 0.3 with Great Updating and Fixing, Especially the Implementing of Getting Runtime Method Context Info and Method Arguments in MSIL Level